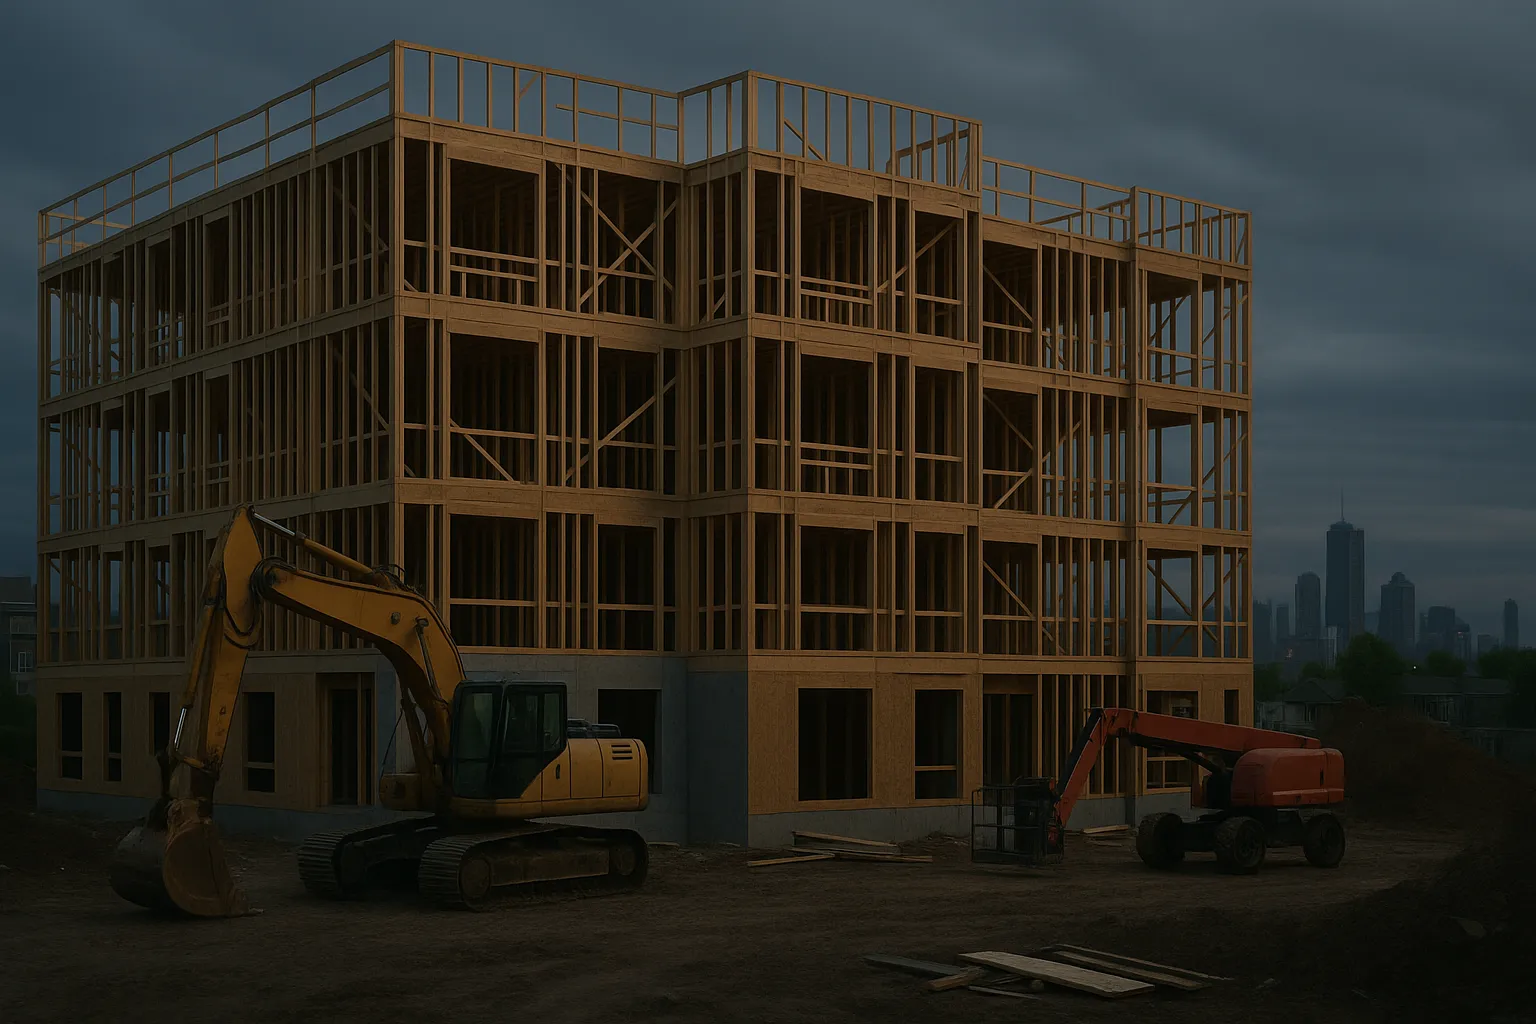
A warning from a major bank’s chief executive flags what construction data has been signalling for months: the housing slowdown that followed the federal budget is only partway through its economic cycle, and the heaviest effects on credit markets and household spending are yet to land.
The alert centres on a simple lag. When residential building activity contracts, the full employment, income and credit effects don’t arrive immediately. They ripple through over 12 to 18 months as projects wind down, subcontractors lose work, and households connected to construction pull back spending.
How the construction-to-credit lag works
Residential construction operates on long timelines. A project approved today won’t employ its peak workforce for six to nine months. When approvals and commencements fall sharply, as they did post-budget, the job losses and income hits don’t show up in aggregate data until those delayed starts would have ramped up.
That employment lag feeds directly into credit markets. Borrowers in construction-linked trades, electricians, plumbers, carpenters, project managers, see income volatility first. Lenders flag this cohort early in their stress monitoring, but actual serviceability failures and arrears don’t spike until those workers miss multiple pay cycles or exhaust savings buffers.
Construction commencements fell 14 per cent in the September quarter 2025 and remained 11 per cent below year-earlier levels through March 2026, according to ABS building approvals data. That means the workforce contraction is still playing out now, not last year.
Which household segments absorb the hit
Three borrower groups carry the greatest delayed risk:
- Construction trades and project-linked workers: electricians, plumbers, site managers, suppliers whose income tracks residential activity. Mortgage stress in this cohort typically lags the construction downturn by two to three quarters.
- Investors in new-build apartments: buyers who purchased off-the-plan in 2024-2025 face settlement in 2026-2027, often into a softer price environment with tighter credit. Serviceability at settlement, not at contract, is what matters.
- Households in outer-fringe growth corridors: areas where employment, retail spending and property values are disproportionately tied to residential construction activity. When building stops, local economies contract faster than established inner/middle-ring suburbs.
Mortgage stress watchlist grows at NAB as applications fall 15% tracked the early-warning signals emerging in late 2025. The gap between early flags and actual arrears is typically six to nine months.
The catch
Most economic commentary treats construction slowdowns as a one-quarter shock. The real damage unfolds over four to six quarters as employment, household income, and credit serviceability all adjust on different timelines.
The second-order credit effects
When construction slows, two credit market pressures build simultaneously:
- Tighter serviceability assessment: lenders price in higher income volatility for construction-linked borrowers, even those not yet in arrears. This shows up as lower borrowing capacity and higher rejection rates for refinancing and new loans.
- Reduced credit appetite from lenders: when a bank’s existing book shows rising stress in one sector, it pulls back new lending to that sector, even to borrowers with strong current serviceability. This is risk management, not a borrower-specific issue, but it compounds the credit squeeze.
Mortgage lending falls $5.4bn: serviceability or cycle? documented the lending pullback in Q2 2026. The construction-linked component of that decline is still accelerating, not stabilising.
Household spending is the other transmission channel. Construction workers facing reduced hours or job uncertainty cut discretionary spending first, dining, retail, home improvements. That spending pullback hits small businesses in construction-heavy suburbs, creating a second wave of income and employment pressure beyond the trades themselves.
Timeline and pressure points
The construction slowdown’s delayed effects follow a predictable sequence:
- Months 0-3 (post-slowdown): commencements and approvals fall, forward pipeline shrinks, but existing projects still employ near-peak workforces.
- Months 3-9: workforce reductions accelerate as projects complete without replacement starts. Income volatility rises for trades and suppliers. Watch-list additions increase but arrears stay flat.
- Months 9-15: serviceability failures and arrears begin rising. Refinancing applications from affected borrowers increase, often declined. Household spending contracts in construction-heavy postcodes.
- Months 15-24: credit tightening feeds back into new construction activity, delaying any recovery even if policy settings improve.
We are currently in months 9-12 of this cycle, based on the September 2025 commencement trough. The next six months carry the highest risk for visible credit stress and spending contraction.
Scenarios and circuit-breakers
Base case: construction activity remains 10-12 per cent below 2024 levels through late 2026. Mortgage arrears in construction-linked cohorts rise 30-40 basis points above system average. Household spending in outer-growth corridors contracts 2-3 per cent year-on-year. Credit availability for new construction-related lending tightens further.
Upside case: federal or state policy response (planning reform, targeted construction subsidies, accelerated infrastructure) stabilises commencements by mid-2026. Employment and income effects still play out but don’t worsen from current trajectory. Credit stress peaks in Q3 2026 then stabilises.
Downside case: construction slowdown deepens if interest rates stay elevated longer than expected or if off-the-plan settlement failures trigger forced sales. Credit tightening becomes self-reinforcing, household spending contracts more sharply, and the recovery timeline extends into 2027.
What could shift the base case: RBA rate cuts in Q2-Q3 2026, meaningful planning reform that accelerates approvals-to-commencement timelines, or targeted lending support for construction-linked borrowers (lower serviceability buffers, longer interest-only periods for trades experiencing temporary income dips).
What this means for decisions now
If you’re a borrower in construction trades or adjacent sectors: pressure-test your serviceability assuming 15-20 per cent income reduction over the next two quarters. Build a cashflow buffer now, three to six months of mortgage repayments plus essential expenses. If you’re planning to refinance, move earlier rather than later; credit availability is tightening, not loosening.
If you’re an investor considering new-build settlements in 2026-2027: recheck your serviceability at today’s rates and lending standards, not the pre-approval from 2024. If the numbers are tight, speak to your lender now about extending settlement or restructuring, before you’re in breach.
If you’re in an outer-fringe growth corridor: watch local employment and retail indicators, not just your own job. When construction stops, the local economy contracts faster than metro averages, and property price support weakens accordingly.
Subscribe to Australian Property Review’s free weekly newsletter for ongoing coverage of credit conditions, construction data and household spending patterns as this cycle unfolds.
General info, not financial advice.