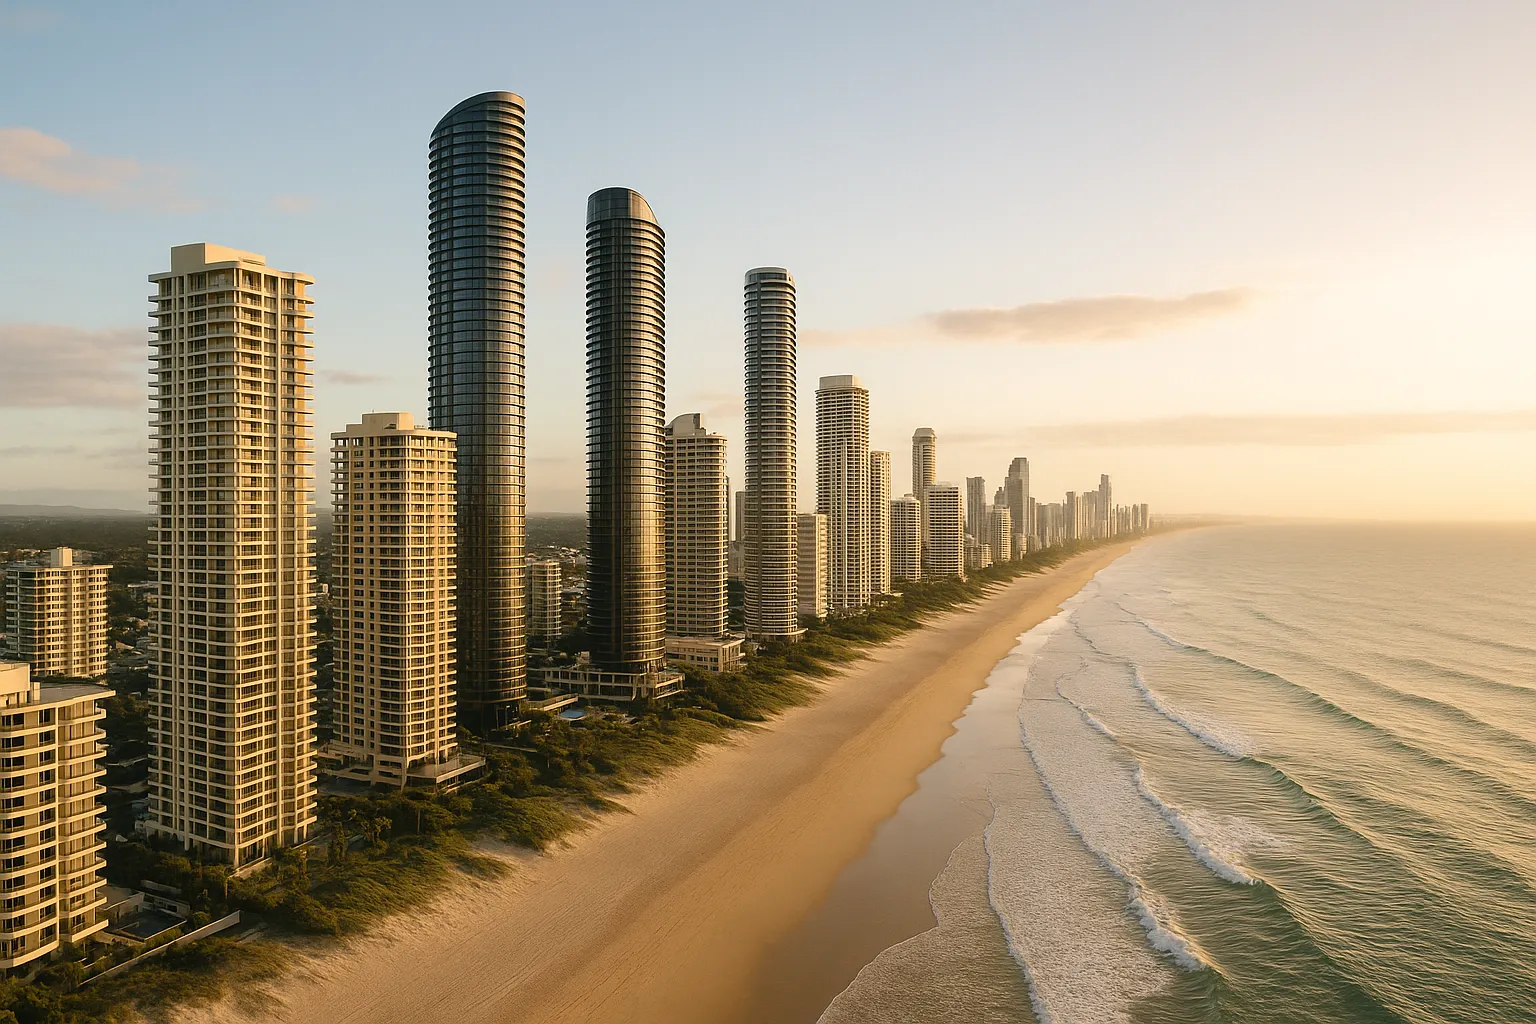
The Gold Coast has logged its first quarterly price decline in years, down 0.72 per cent across July to September 2024, as borrowing limits tighten and the holiday strip’s premium positioning, once a magnet for lifestyle migrants, turns into a liability.
With a median dwelling price of $1,167,000, the market is now running headlong into the reality that fewer buyers can service loans at those levels, even as nominal prices ease. Houses bore the sharpest correction, falling 0.97 per cent quarter-on-quarter to a median of $1,421,000, while units scraped through almost flat at $957,000.
Annual growth still sits at 5.5 per cent for all dwellings, but that number masks what’s happening in real time: the premium end of regional Queensland is cooling faster than cheaper alternatives, and the arithmetic of affordability is working against it.
The premium trap
The Gold Coast’s median dwelling price sits roughly 40 per cent above the broader Queensland regional average, a gap built during the 2020–2022 lifestyle migration wave when borrowing was cheap and remote work made the coast newly viable for southern buyers.
Now that same premium is the problem. At current interest rates, a $1.4 million house loan requires annual household income north of $250,000 to meet serviceability buffers, a threshold fewer buyers clear as wage growth lags inflation and lenders tighten assessment floors.
The result: the market that climbed highest on cheap credit is now most exposed when credit conditions reverse. Cheaper regional markets with medians below $800,000 face the same headwinds but start from a base more households can actually finance.
Houses down, units holding
Houses have taken the brunt of the correction, shedding nearly 1 per cent in the quarter as the top end stalls. Units, meanwhile, posted marginal growth of 0.03 per cent month-on-month and are still tracking 6.5 per cent higher year-on-year.
That divergence points to a clear buyer shift: households priced out of detached stock are stepping down to units to maintain a foothold in the region, compressing unit supply and keeping a floor under that segment, for now.
But unit resilience depends on continued buyer interest at the margin, and if serviceability constraints deepen or employment softens, that support evaporates quickly.
The borrowing power wall
Prices falling 0.72 per cent sounds like an opening for buyers, but the math doesn’t work that way. Borrowing capacity has contracted by more than prices have dropped, a household that could borrow $1.2 million 18 months ago now qualifies for closer to $950,000, even as the median has only eased from $1,175,000 to $1,167,000.
So the affordability improvement is mostly illusory: nominal prices are down slightly, but the gap between what buyers can borrow and what sellers are asking has widened, not closed.
That gap is the binding constraint now, not sentiment or supply. Buyers who want in are running into hard serviceability limits, and sellers holding firm on 2023 price expectations are finding fewer qualified bidders.
What comes next
Base case: modest further decline through summer 2024–25 as stock accumulates and serviceability stays tight, with houses continuing to lead the fall and units providing relative support. Total downside 3–5 per cent peak-to-trough if rates hold and employment stays stable.
Upside scenario: rate cuts arrive earlier than priced (mid-2025), borrowing capacity expands, southern buyers return chasing relative value versus Sydney/Melbourne. Prices stabilise by year-end and recover modestly into 2026.
Downside scenario: unemployment rises above 4.5 per cent, forced selling accelerates, investor appetite collapses as yields stay compressed and vacancy ticks higher. Prices fall 8–12 per cent from peak, with houses and outer precincts hit hardest.
The next four months will clarify which path is forming, watch auction clearance rates, days-on-market trends, and whether spring stock absorption stalls or clears.
Pressure points to track
- Clearance rates below 50 per cent for three consecutive weeks would signal buyer strike is deepening
- Stock-on-market rising above 15,000 listings (currently ~12,500) would indicate sellers capitulating on price to clear
- Investor loan approvals falling below 30 per cent of total lending would confirm the yield-chasing cohort has exited
- Rental vacancy climbing past 2 per cent would remove the cashflow cushion keeping investor sellers patient
If two or more of those break in the next quarter, the base case shifts materially toward the downside scenario.
The practical take
If you’re buying on the Gold Coast now, the headline price drop is less relevant than your actual borrowing limit, run a full serviceability check with a broker before making offers, because the gap between asking prices and what you can borrow may be wider than it looks.
If you’re holding and can carry the loan comfortably, there’s no distress-sale pressure yet, but list early if you need to move in the next 12 months, spring is the last window before summer softness and potential further rate pressure.
For investors weighing entry, the yield picture has improved marginally (units now returning 4–4.5 per cent gross in some precincts), but capital growth is off the table for at least the next 12–18 months, so this is a cashflow play only if you’re buying with a long hold horizon and can handle flat to negative equity in the near term.
Mortgage lending fell $5.4 billion nationally in Q2 2024, and the Gold Coast’s premium positioning makes it more, not less, exposed to that contraction.
Next steps
Subscribe to the newsletter for the weekly signal on when borrowing capacity expands again and what that means for premium regional markets.
General info, not financial advice.