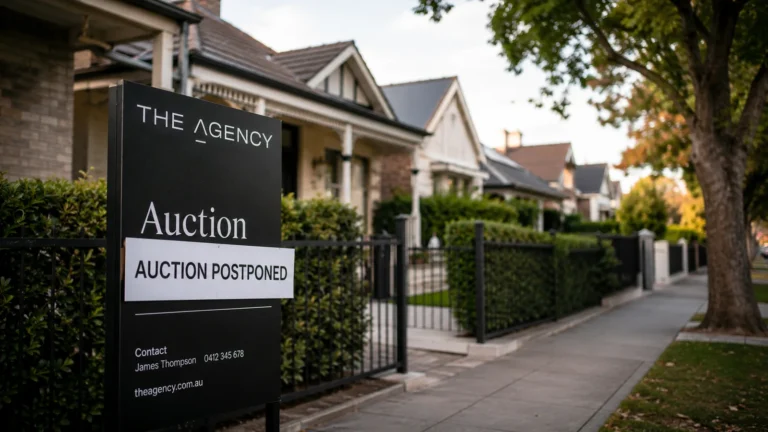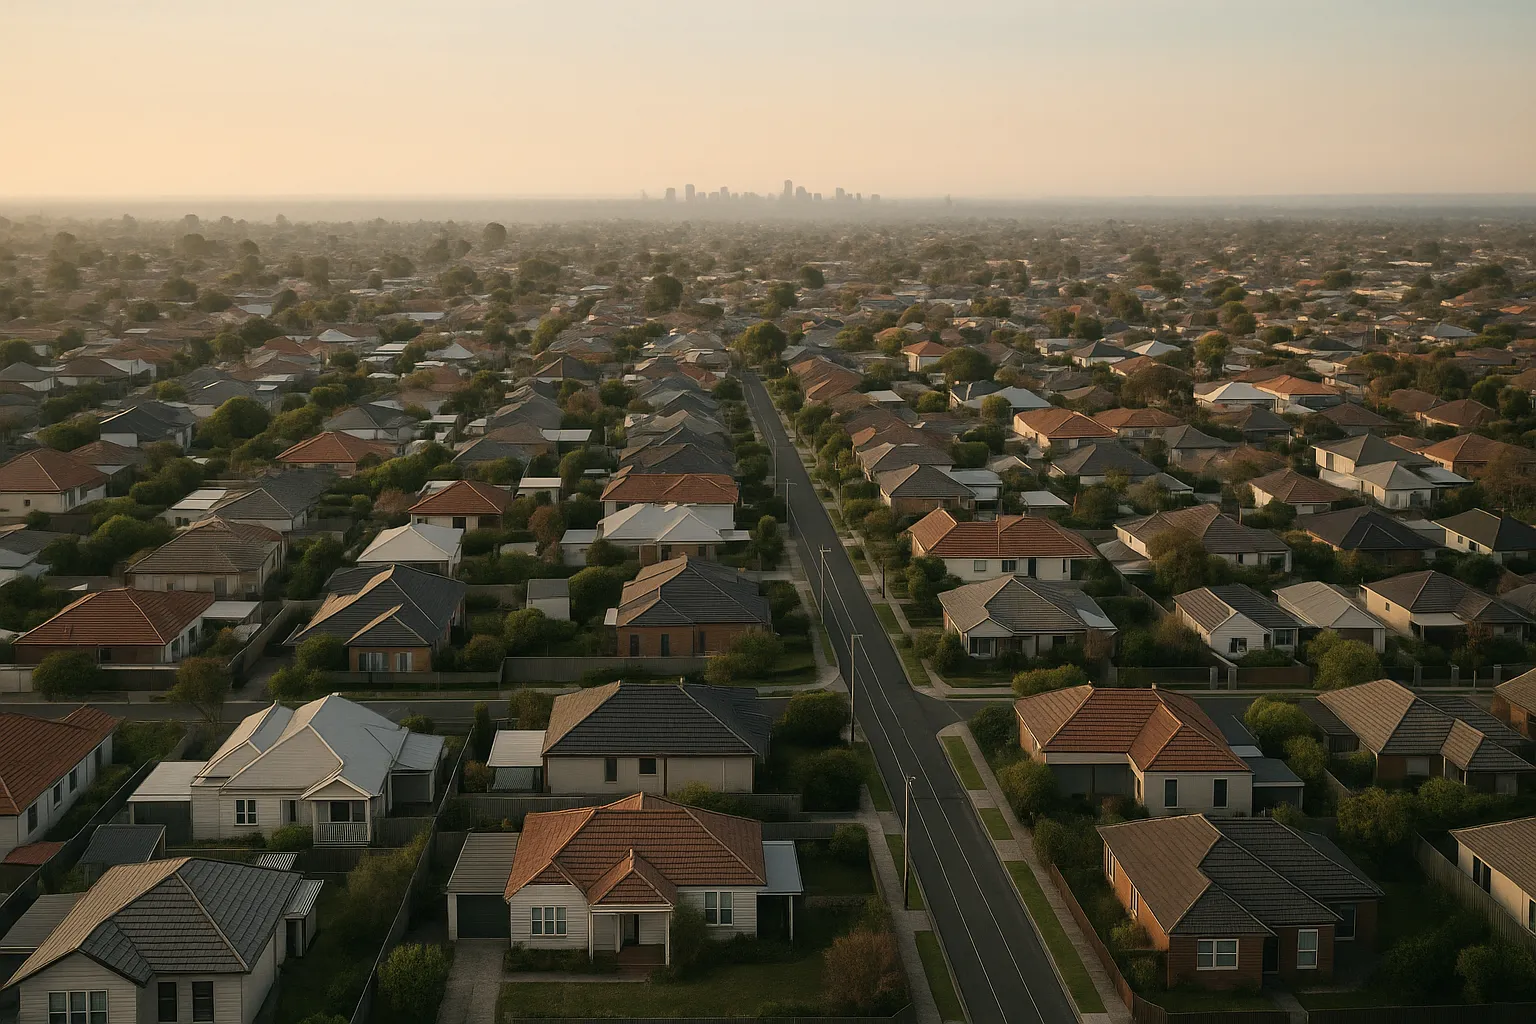
Melbourne’s median house price sat at $964,000 in August, down $65,000 since October last year and now $7,700 below spring 2021. The city has logged ten consecutive months of declines, the longest run since 2019, and the pace suggests something beyond interest-rate mechanics.
The federal government’s May budget introduced changes to negative gearing and capital gains tax settings for property investors. Those measures arrived into a market already carrying state-level headwinds: Victoria’s property tax environment had tightened during the previous government, population outflows during lockdowns hadn’t fully reversed, and supply had grown faster than in other capitals during 2020–2021.
How the policy stack works
Federal negative gearing changes reduce the immediate tax benefit of holding negatively geared investment properties. The capital gains tax discount was also adjusted, lifting the effective tax rate on gains when investors sell. These don’t ban investment, they shift the after-tax return enough that marginal buyers pause or exit.
At the state level, Victoria’s land tax and vacancy levy settings had already been less favourable to investors than settings in Queensland or New South Wales. When you layer the federal changes on top, the combined effect compresses investor cashflow from both ends: higher holding costs, lower tax relief, reduced upside on exit.
That’s visible in the data. Investor selling activity has increased, and new investor buying has slowed. The result is more listings competing for fewer cashed-up buyers, which puts downward pressure on clearance rates and then prices.
The catch: affordable areas aren’t getting cheaper
You’d expect a $65,000 median drop to open doors for first-home buyers. It hasn’t. More affordable suburbs are holding up better than expensive ones, so the price compression is happening where entry buyers weren’t shopping anyway.
Meanwhile, borrowing capacity continues to shrink. If the Reserve Bank adds one more hike before year-end, still possible given inflation tracking above target until at least 2027, serviceability buffers tighten further. A buyer approved for $800,000 in March might be approved for $760,000 in November, which offsets much of the price decline.
This creates a scenario where prices fall but accessibility doesn’t improve proportionally. The gap between what a median household can borrow and what a median property costs is narrowing slower than the headline number suggests.
Comparative performance and what it signals
Melbourne has gained 37 per cent over the past decade. Brisbane, Adelaide, Perth and Hobart have all doubled. That divergence reflects both structural factors, Melbourne built more supply during the boom, which capped upside, and policy/sentiment factors that are harder to reverse quickly.
Regional Victoria’s median house price fell $1,200 in August and sits $7,000 below its prior peak. Unit prices in Melbourne were flat at $613,000 but down $13,000 from their high. These aren’t collapse-level declines, but the consistency matters: ten months without a bounce suggests the factors driving this aren’t temporary noise.
Key numbers
- Melbourne median house price: $964,000, down $65,000 (6.3%) since October, $7,700 below spring 2021
- Ten consecutive months of declines, longest run since 2019
- Decade performance: Melbourne +37%, Brisbane/Adelaide/Perth/Hobart all doubled
- Regional Victoria median: down $7,000 from peak; Melbourne units down $13,000
What amplifies or reverses this
Three variables determine whether this correction extends or stabilises:
- RBA decision path: One more hike compounds the serviceability squeeze. A hold, or early 2025 cuts, would lift sentiment and borrowing capacity in tandem.
- Federal policy clarity: If negative gearing/CGT changes are legislated without further adjustment, investors price the new reality and some return. If the settings remain under review or get tightened again, selling pressure continues.
- State budget response: Victoria’s stamp duty and land tax revenue depends on transaction volumes and stable prices. If the state adjusts settings to reduce holding costs for investors or first-home buyers, that eases one layer of the policy stack.
Base case: another three to six months of modest declines, then stabilisation as investor tax changes get fully priced and RBA cuts begin mid-2025. Downside: a late-2024 rate hike extends the correction into Q2 2025 with another 3–5% drop. Upside: RBA signals cuts earlier than expected, federal government softens investor settings, sentiment turns faster than borrowing capacity justifies.
Bottom line
Melbourne’s decline isn’t a rate story alone. Federal investor tax changes and state-level policy settings have stacked to reduce demand faster than supply has adjusted. Prices are falling, but affordability isn’t improving at the same rate because borrowing capacity is shrinking too.
If you’re holding Melbourne property, pressure-test cashflow against one more rate rise and factor in the possibility this runs another six months. If you’re buying, Melbourne auction volumes hit their lowest spring start since 2021 lockdowns, clearance rates and days-on-market are better buying signals than median movements. If you’re an investor weighing entry, wait for federal policy settings to land in legislation before committing capital.
Subscribe to Australian Property Review for weekly updates on what’s moving markets and what it means for your next decision.
General info, not financial advice.