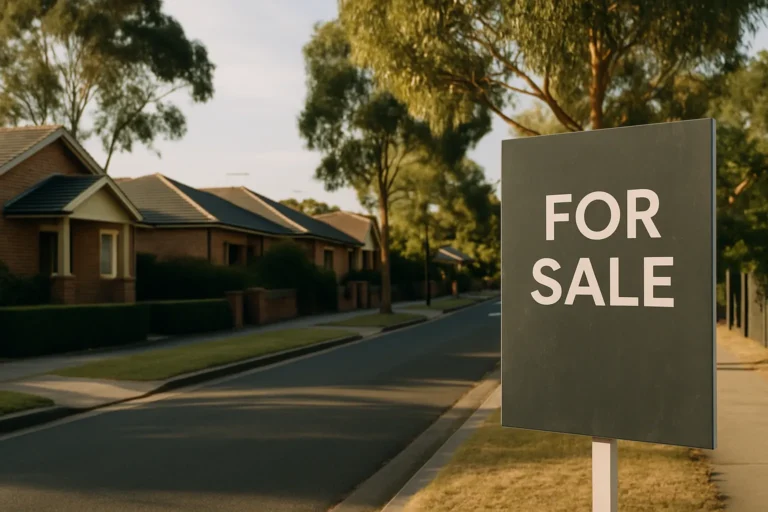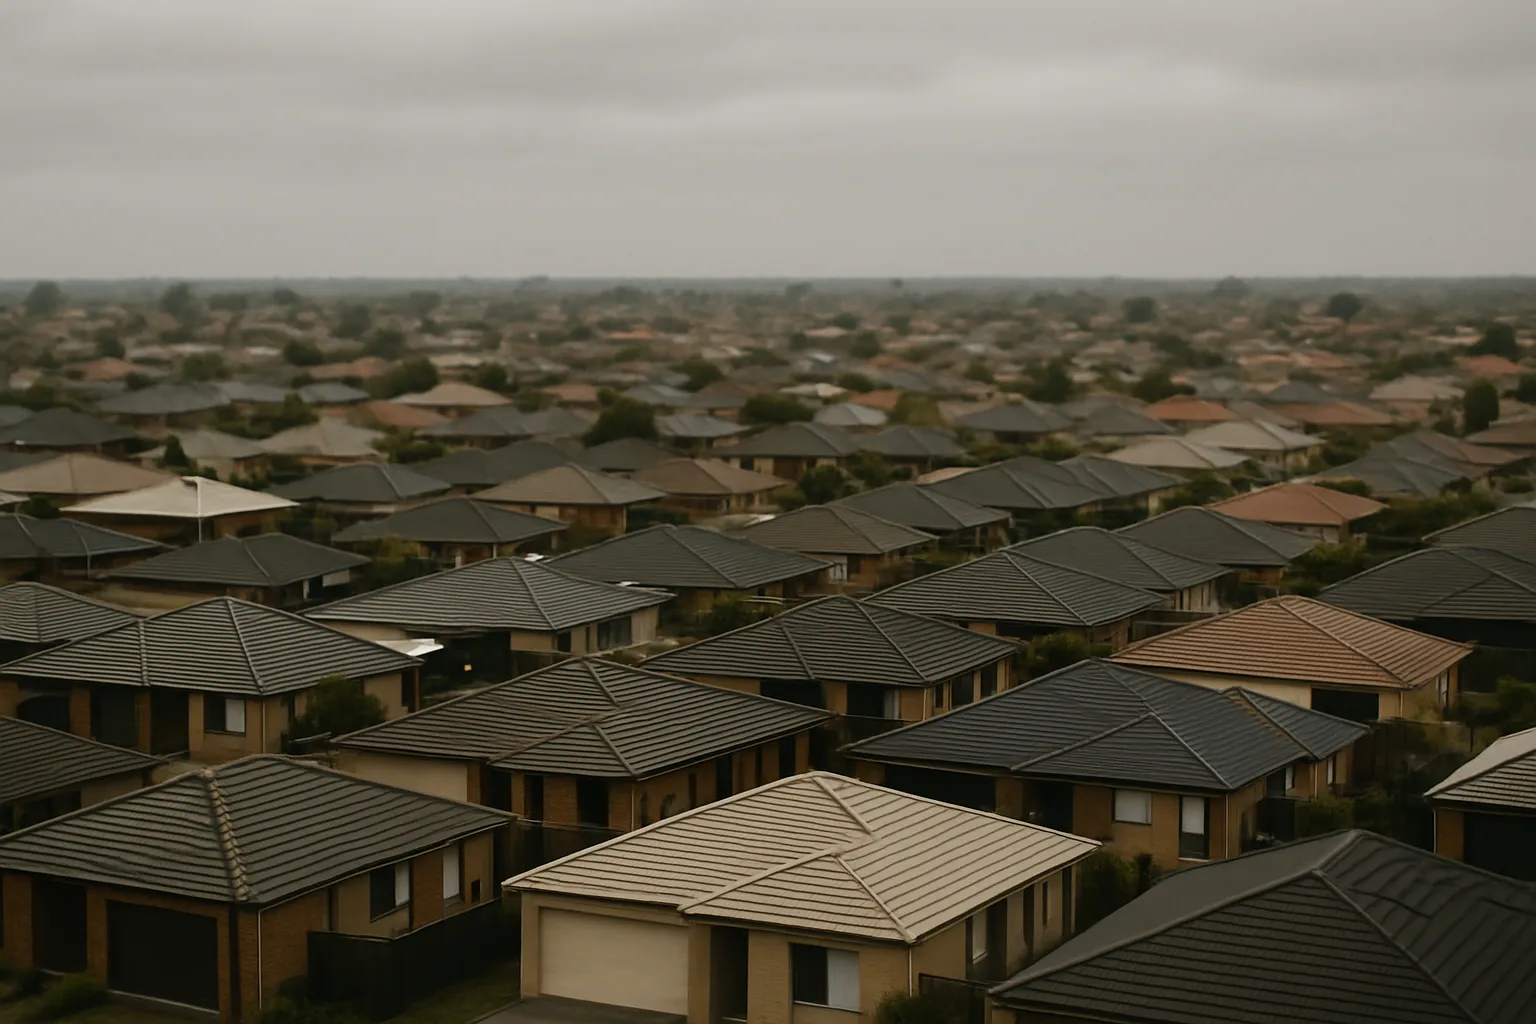
Price declines have accelerated across most capital cities over the past month, running ahead of the forecasts major lenders published just six weeks ago. Credit enquiries have dropped back to late-2022 levels. Auction clearance rates in Sydney and Melbourne have hit previous cycle lows. Sales volumes are contracting faster than new listings, pushing total stock on market higher and shifting bargaining power toward buyers for the first time in years.
A major bank’s chief economist described the phase as an “air pocket” in early August 2026 analysis, arguing the combination of sustained high rates and May’s budget tax changes is weighing on demand without triggering a crash. The view rests on three pillars: credit remains available, employment is holding, and very few borrowers sit in negative equity even after recent falls.
What’s driving the pullback
Monthly price declines are now visible in most capitals. The pace is uneven: Melbourne has softened more sharply than Sydney or Brisbane, and local conditions vary within each city. Buyer enquiries measured by home loan credit applications have fallen roughly 4 per cent per month since the third consecutive rate hike. Auction clearance data shows competition has thinned, with fewer bidders per property and more stock passing in.
The May budget’s changes to tax treatment for existing investors removed part of the financial case for holding negatively geared properties, though the effect varies by individual cashflow and marginal tax rate. Westpac’s revised forecast now removes two previously expected rate hikes and brings forward the first cut to August 2027, a full six months earlier than the bank’s February 2028 timeline. That shift suggests the market softening is influencing rate expectations, even if the RBA’s mandate does not include property prices directly.
Why this isn’t 2008 or even 2018
Negative equity remains rare outside a narrow band of buyers who purchased at the 2024–2025 peak with very high loan-to-value ratios. Most borrowers entered the market earlier or with larger deposits. Unemployment is forecast to rise, but from slower hiring rather than mass redundancies. Borrowers who keep their jobs are statistically unlikely to become forced sellers, and lenders have shown little appetite for distressed sales when serviceability buffers remain in place.
Owner-occupiers facing a falling market typically defer selling rather than crystallise a loss. Existing investors under the new tax settings have limited financial incentive to exit unless cashflow has become unmanageable. The base case is therefore prolonged low turnover, not a wave of distressed listings. This is consistent with investor retreat patterns tracked earlier this year, where reduced new purchases drove softening rather than panic exits.
The catch
Low turnover protects prices from a sharp crash, but it also means liquidity dries up. Sellers who need to move for work, family or financial reasons face a thinner buyer pool and longer time on market. Buyers gain negotiating room, but the supply they can access skews toward stock that wasn’t moving even in stronger conditions. The “air pocket” framing assumes employment holds and rates eventually fall, but if either assumption breaks, the floor on forced sales lifts quickly.
RBA policy operates on inflation and employment mandates, not housing stability. The bank has weathered three previous downturns this decade without altering its rate path to support prices. If core inflation remains sticky or wage growth undershoots, rate cuts could be delayed beyond August 2027, extending the correction and testing whether the no-forced-sales assumption holds into 2028.
Key numbers
- Credit enquiries down ~4% per month since the third rate hike
- Auction clearance rates at Sydney and Melbourne cycle lows
- Stock on market rising as sales contract faster than new listings
- First rate cut now forecast for August 2027, six months earlier than prior timeline
- Negative equity remains rare outside peak-period, high-LVR purchases
Scenarios over the next twelve months
Base case: gradual softening through late 2026, stabilisation in early 2027 as rate-cut expectations firm, turnover remains low, forced sales stay rare. Upside: inflation falls faster than expected, RBA cuts earlier, sentiment rebounds, spring 2027 sees renewed buyer activity. Downside: unemployment rises beyond forecast, cashflow stress climbs, investor exits accelerate, liquidity crunch pushes clearance rates and prices lower into 2028.
The short positions against Australian banks totalling $11 billion suggest some institutional players are pricing downside risk more heavily than the consensus.
What to watch
Monthly auction clearance trends in Sydney and Melbourne through spring. Employment data, particularly whether job losses start replacing slower hiring. RBA commentary in the November statement on whether housing weakness influences the inflation-employment trade-off. Total stock on market: if new listings hold steady while sales keep contracting, bargaining power shifts further and days on market stretch. Serviceability buffers among borrowers who refinanced at lower rates in 2023–2024 and are now rolling onto higher fixed terms.
One practical step
If you’re holding an investment property with negative or marginal cashflow, run the numbers on how many months you can sustain current settings if rates stay at 4.35 per cent through mid-2027. If the answer is fewer than twelve, model whether selling now into a softening market beats holding and hoping for a cut that may arrive later than forecast. If you’re a buyer with capacity, this is the first real negotiating window since 2022, but liquidity risk means longer settlement periods and more due diligence on vendor motivation.
For the weekly market signal, subscribe to the newsletter.
General info, not financial advice.