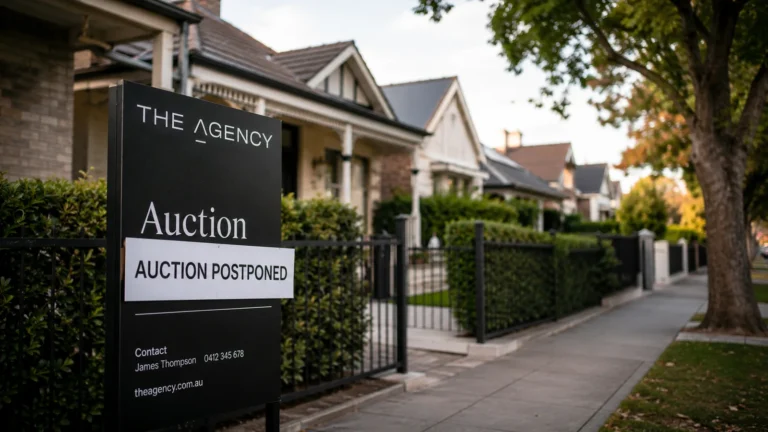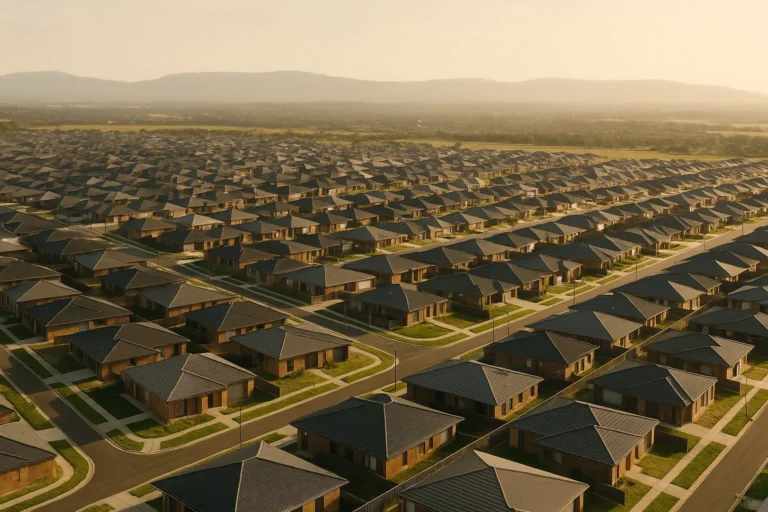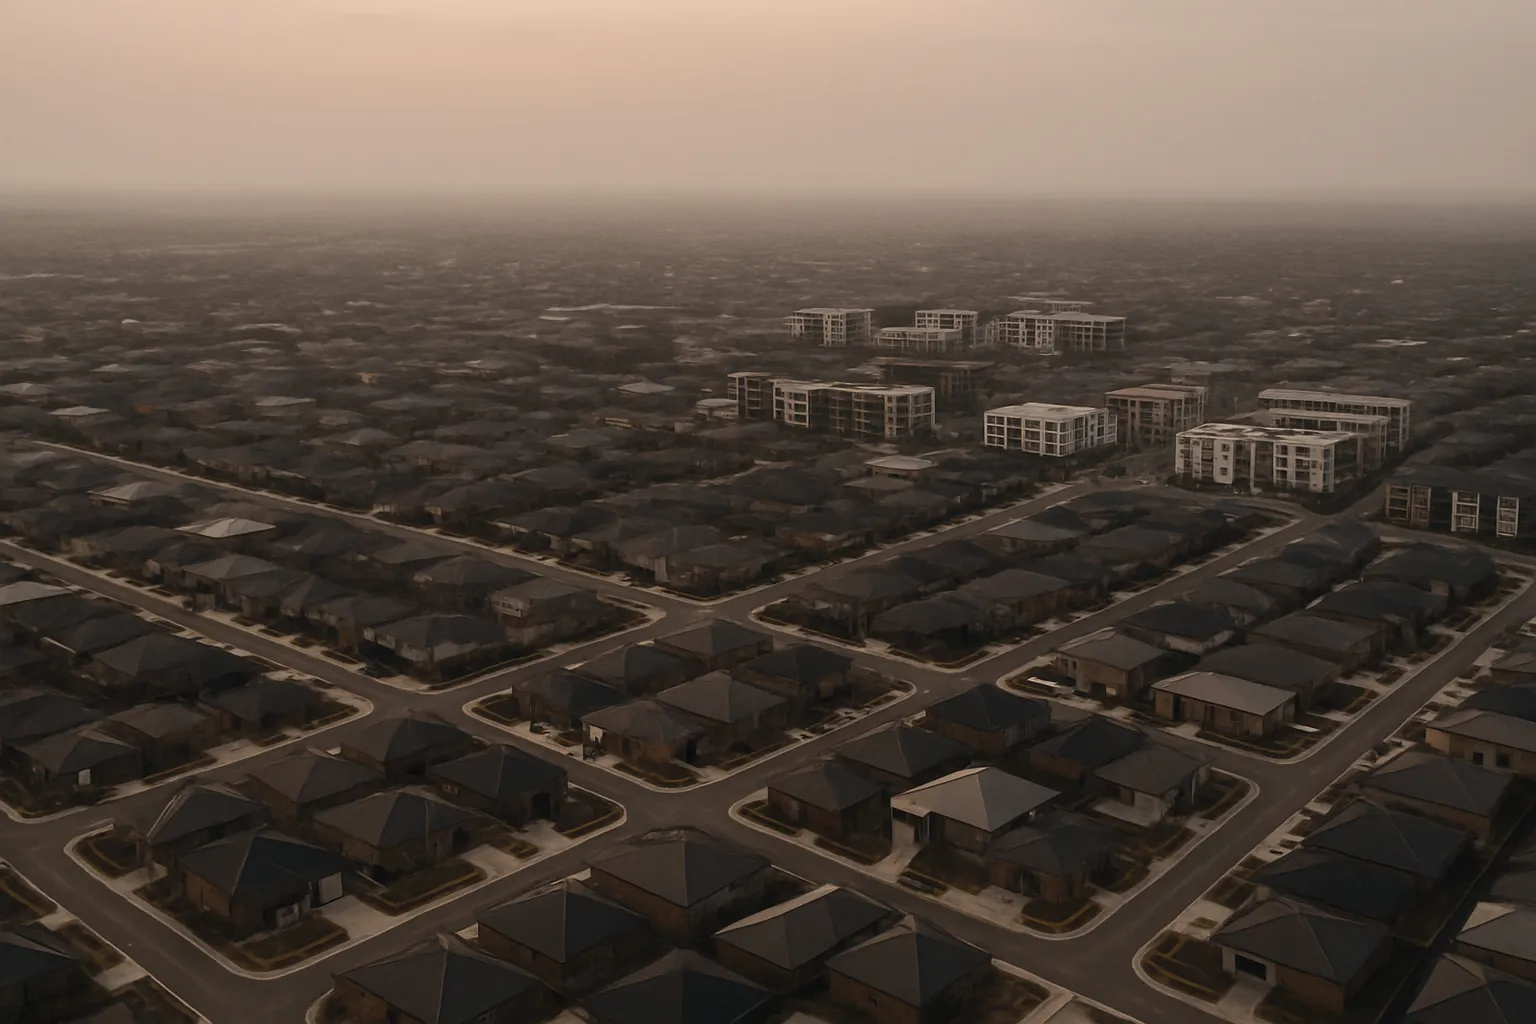
Parts of Melbourne’s property market have shed serious value from recent peaks. While the city-wide median tells a story of soft declines and modest recovery, drilling into individual suburbs reveals sharp, concentrated falls, some in double digits, that expose which buyer cohorts and property types are carrying the weight of affordability stress, rate rises and global uncertainty.
The falls aren’t evenly spread. They cluster in predictable places: outer-growth corridors where recent construction flooded supply, unit-heavy precincts where investor cashflow has turned negative, and suburbs where buyers stretched serviceability at the 2021–22 peak and are now walking away or forced to sell.
The suburbs absorbing the biggest losses
Outer-ring growth areas, think 30–50 km from the CBD, dominate the hardest-hit list. These suburbs attracted heavy first-home and investor activity during the pandemic boom, often with thin equity buffers and maximum borrowing. Now, with rates up 425 basis points since May 2022 and wages growing slower than repayments, serviceability has cracked.
Unit markets in middle-ring precincts are the second pressure point. Apartments that sold for $600k–$800k in 2021 are now struggling to find buyers at $550k, especially in buildings with high body-corporate fees, no car spaces, or oversupply from nearby developments completing at once. Yields haven’t kept pace, vacancy rates in some apartment-heavy postcodes have climbed above 4 per cent, turning positive-cashflow plays into negatively-geared holes with no capital gain to offset the bleed.
Houses in these same outer areas are falling too, but the unit segment is cracking harder and faster because investors, who make up a larger share of unit buyers, are more willing to cut losses when the numbers stop working.
What’s pulling these areas down
Three forces are compounding.
First, affordability has reset sharply. A household earning $120k could service a $750k loan at 2.5 per cent. At 6.5 per cent, that same household qualifies for around $550k. Buyers who stretched to the edge in 2021 can’t replicate that purchase today, so the pool of qualified buyers has shrunk, and sellers in outer suburbs, where price is the main competitive lever, have to drop to meet the new ceiling.
Second, construction costs have created a floor that isn’t helping. New-build costs for detached houses are still sitting near $2,500–$3,000 per square metre in many growth corridors, which theoretically should put a floor under established-home prices. In practice, it’s doing the opposite: it’s stalling the market. Buyers who can’t afford new and can’t stretch to established are simply delaying, leaving sellers with longer days-on-market and fewer bids.
Third, investor sentiment has soured in pockets where vacancy has spiked and body-corporate or land-tax costs have jumped. An investor who bought a two-bedroom unit off-the-plan in 2020 for $650k, settled in 2022, and is now facing $30k annual holding costs with six weeks vacancy and a valuation at $580k is not a happy camper, and many are listing to escape before the hole gets deeper.
The trade-off no one’s talking about
The same construction-cost floor that’s supposed to prevent further falls is also preventing a recovery. Builders can’t drop new-home prices below cost, so the gap between new and established stays wide, but if established prices fall another 5–10 per cent in these areas, that gap just stretches further, and the established market stays stuck.
That creates a scenario where prices don’t crash (because distressed sales are still relatively rare and banks are working with borrowers), but they don’t recover either. Suburbs that peaked in early 2022 could sit 10–15 per cent below peak for another 12–24 months, waiting for wage growth and rate cuts to close the serviceability gap and bring buyers back.
The risk is that this stall becomes self-reinforcing: if buyers expect prices to stay flat or drift lower, they delay, which keeps turnover low and price discovery weak, which confirms their pessimism.
Who’s most exposed
Three cohorts are carrying the pain.
- First-home buyers who stretched in 2021–22: Thin equity, maximum LVR, now underwater or close to it if they need to sell. Many are staying put and grinding through higher repayments, but forced sales (job loss, relationship breakdown, relocation) are the ones driving price discovery lower.
- Small investors in outer-area units: Negative cashflow, falling valuations, no capital gain to justify the hold. Some are selling, some are holding and hoping, but the ones who bought multiple properties in the same pocket are feeling it hardest.
- Developers who settled land in 2021–22: Holding costs are high, presales are slow, and the gap between what they need to sell for and what buyers will pay has widened. Some are mothballing projects; others are cutting prices and eating the margin to get stock moving.
Key numbers
- Outer-growth suburbs: some postcodes down 12–18 per cent from peak, based on recent transaction patterns and comparable-sales data in similar Melbourne corridors
- Unit vacancy rates in oversupplied precincts: 4–5 per cent, vs. metro average of 2.8 per cent
- Rate rises since May 2022: 425 basis points, cutting borrowing capacity by roughly 25 per cent for the same repayment
- Construction cost floor: $2,500–$3,000/sqm for detached houses in growth areas, holding but not helping
Downside and upside paths
Base case: these suburbs stay flat to down another 3–5 per cent over the next 6–12 months, then stabilise as rate cuts (if they come) and wage growth slowly rebuild serviceability. No sharp crash, but no quick recovery either, just a long, low-volume grind.
Downside: if unemployment ticks up or another global shock hits (trade war, credit event, recession offshore), forced sales accelerate and the 10–15 per cent falls we’ve seen so far become 18–22 per cent. Developers pull back further, construction stalls, and the supply overhang in some unit markets gets worse as investors all try to exit at once.
Upside: rate cuts arrive sooner and deeper than expected, wages accelerate, and net migration stays strong enough to absorb the oversupply in unit markets. Buyers come back, days-on-market shrink, and these suburbs recover half their losses within 18 months. Possible, but requires several things to break right at once.
Bottom line for decision-makers
If you own in one of these suburbs: don’t panic-sell unless your circumstances force it, but don’t expect a quick recovery either. Run your cashflow with rates at current levels for another 12 months, and if that’s sustainable, wait it out.
If you’re thinking of buying in a hard-hit pocket: the falls are real, but so is the stall risk. Don’t catch a falling knife assuming you’re getting a bargain, make sure the numbers work at today’s rates and rents, with no capital gain assumed for at least two years.
If you’re an investor comparing opportunities: look at vacancy, body-corporate, yield and days-on-market, not just the price drop. A 15 per cent fall in a suburb with 5 per cent vacancy and weak rental demand is not the same as a 10 per cent fall in a tighter market with 2 per cent vacancy.
Subscribe to the newsletter for the weekly read on what’s shifting in Australian property, without the spin.
Related: Australian housing market correction deepens as bank revises outlook, Mortgage default risk hits record high as 18% quarterly jump exposes outer-suburb strain.
General info, not financial advice.