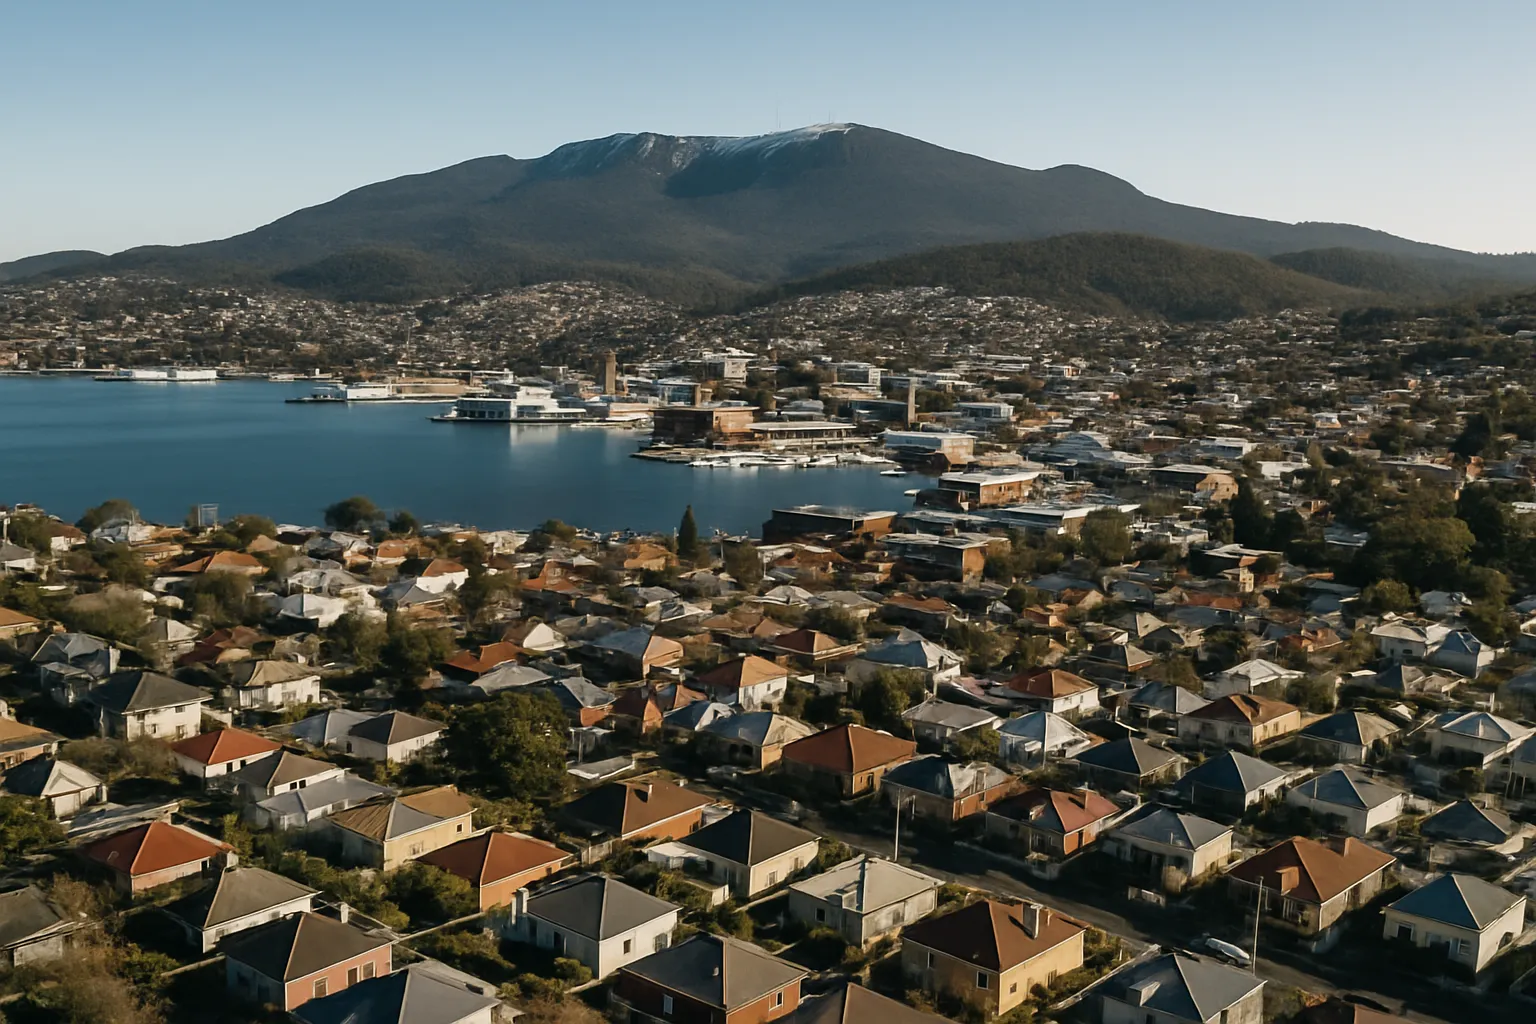
Hobart dwelling values crept up 0.1 per cent in July and gained 1.4 per cent over the previous quarter, according to property analyst Cotality. That puts the southern capital second only to Darwin for near-term momentum at a time when most mainland markets are flat or falling. The city’s median house price now sits at $805,165, up 9.5 per cent over the year; units reached $587,863, up 8.1 per cent.
The resilience isn’t about detachment from national credit conditions. Buyers are taking longer to commit, open-home foot traffic is still present but conversion has slowed, and investor activity has largely dried up over the past twelve months. The difference is what’s happening on the supply side and in the rental market.
The supply constraint
Listings in Hobart are down roughly 25 per cent year-on-year. Winter typically suppresses new stock as sellers wait for warmer weather and better presentation conditions, but the shortage predates seasonal patterns. Low inventory is holding price levels even as buyer depth thins.
That dynamic can flip quickly. Industry observers expect a wave of new listings from October as spring arrives and mainland buyers firm up decisions ahead of the school year. Whether prices hold through that supply lift depends on whether demand absorbs the extra volume or whether the dam-wall effect overwhelms thinner buyer pools.
Rental growth and yield support
House rents in Hobart rose 8.3 per cent over the year to July, second only to Darwin’s 11.3 per cent. Unit rents climbed 6.9 per cent, again trailing only Darwin and Perth. Vacancy rates remain very low, and gross yields sit among the strongest in the country.
For investors who bought in the past two years, that combination of capital growth and rental return has delivered solid total returns. The question now is whether yield alone can sustain interest if price appreciation stalls or reverses when listings surge.
Who’s still buying
The Hobart market typically splits 70 per cent local purchasers, 15 per cent mainland buyers and 15 per cent investors. Twelve months ago, investor activity was strong enough to drive multiple offers on well-priced stock. That cohort has now largely withdrawn, either priced out by serviceability tightening or waiting for clearer signals on the national cycle.
Mainland buyers remain active, particularly in the October-to-December window when families coordinate relocations around schooling. The $1.13 billion Macquarie Point stadium project is expected to bring construction workers and related demand over the next few years, though the timing and scale of that inflow are still uncertain.
The median owner-occupier loan size in Tasmania was $516,000 in the June quarter, the lowest of any capital and down 1 per cent over the quarter despite a 7 per cent annual rise. That suggests affordability remains a relative advantage compared to Sydney or Melbourne, but it also reflects Tasmania’s lower income base and the limits that imposes on borrowing capacity as rates stay elevated.
Regional outperformance
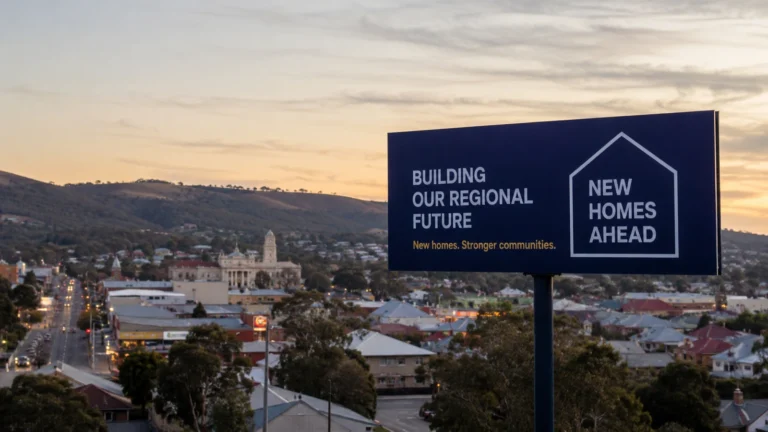
Outside Hobart, price growth has been stronger. The state’s regional median dwelling value rose 120.5 per cent over the past decade, compared to Hobart’s 94.4 per cent. Central Highlands led recent gains, up 16.3 per cent over the year to a median of $488,722. Burnie-Ulverstone and Launceston both posted double-digit annual growth.
That divergence reflects a combination of work-from-anywhere migration, lower entry prices and delayed catch-up from years of underinvestment in regional housing stock. It also means regional Tasmania is more exposed to a reversal if remote-work trends stall or if interest rates stay higher for longer than borrowers anticipated.
Tasmania property market outpaces capitals, but can it last?
The historical pattern
Tasmania has historically avoided the sharp booms and busts seen in Sydney or Melbourne. When national markets correct, Hobart typically flattens rather than falling hard. That stability reflects smaller speculative flows, lower leverage ratios and a buyer base weighted toward end-users rather than short-term flippers.
But that pattern also means Hobart tends to lag national upswings. If mainland capitals recover over the next 12 to 24 months on the back of rate cuts or renewed credit availability, Hobart may see more modest gains simply because it didn’t overshoot as much on the way up.
What could change the picture
Three factors matter most over the next two quarters. First, the volume and pricing of spring listings. If sellers flood the market chasing exits before a deeper slowdown, prices could soften quickly given the thinner buyer pool. Second, whether mainland buyers return in their usual October-December numbers or hold off amid national uncertainty. Third, the pace of rental growth. If rents flatten or vacancy ticks up, yields compress and investor interest weakens further.
The Macquarie Point stadium construction timeline adds a wildcard. If worker inflows arrive on schedule and demand rental stock, that could support both rents and prices in the inner suburbs. If the project stalls or labour is sourced outside the state, that support disappears.
Practical takeaway
If you’re considering Hobart as an investment market, the yield case is stronger than the capital-growth case right now. Rents are rising, vacancy is tight, and entry prices remain below most mainland capitals. But that calculus depends on rental demand holding and supply staying constrained. Spring listings will tell you whether the supply picture is genuinely tight or just seasonally suppressed.
For owner-occupiers, the relative affordability and lifestyle appeal remain intact, but buying into a market where 25 per cent fewer properties are listed means less choice and potentially paying a premium for scarcity. If you’re relocating from the mainland, compare Hobart yields and loan serviceability against similar regional markets in NSW or Victoria before assuming Tasmania is the only game in town.
What to watch next quarter
- Spring listing volumes from October: if stock jumps above 30 per cent year-on-year, price pressure builds
- Rental vacancy data: any uptick above 1.5 per cent signals softening yield support
- Mainland buyer activity in the October-December window: a drop below the usual 15 per cent of sales would flag broader caution
- Macquarie Point construction workforce arrival timeline: delays weaken near-term demand assumptions
Subscribe to the newsletter for weekly updates on regional market moves and what they mean for your next decision.
General info, not financial advice.