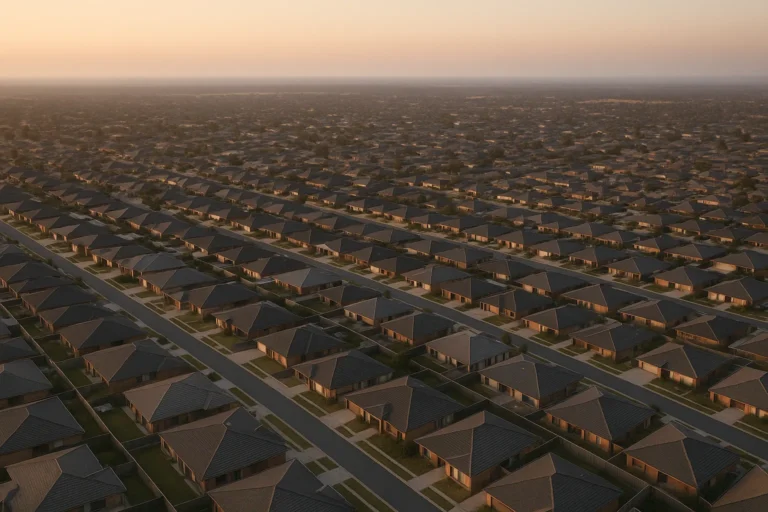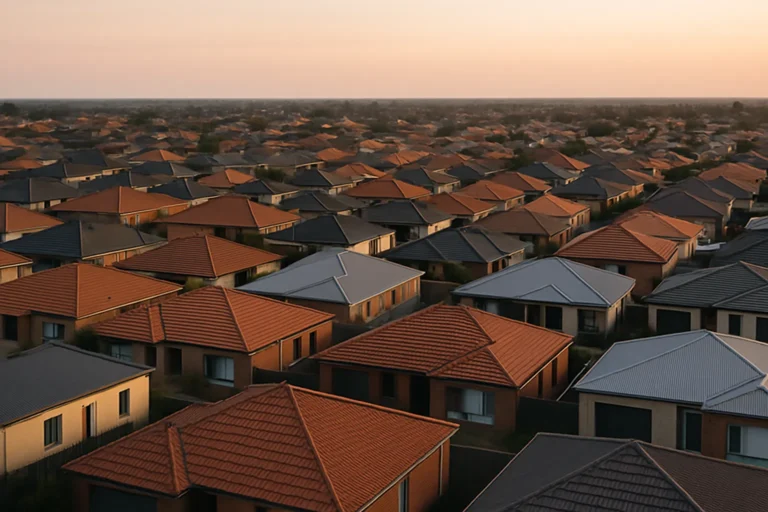
The Reserve Bank is expected to lift the cash rate to 4.6% this afternoon, with markets pricing a 60% chance of a sixth increase by mid-2027. If that unfolds, property prices could fall 15-20% from peak, but the monthly cost of servicing what’s left will likely be higher than it is right now.
That’s the affordability paradox sitting at the centre of this cycle: borrowing capacity is contracting faster than prices, so a nominally cheaper property becomes functionally harder to carry. The policy assumption that corrections improve access only holds if serviceability keeps pace with the decline. It hasn’t.
Why borrowing power matters more than the price tag
Affordability isn’t just the deposit, it’s whether a household can service the loan month to month. At 4.35%, a couple earning $150,000 combined can borrow roughly $730,000 at a 3% buffer. Two more rate rises push the assessment rate past 10%, and that same couple’s capacity drops below $640,000, a $90,000 cut.
If the median price in their target suburb falls 10% from $850,000 to $765,000 over the same period, they’re still $125,000 short. The property got cheaper, but they got further away from it.
That gap is why the Housing Industry Association’s national affordability index hit its lowest point on record at the end of June, and why analysts now expect no improvement through 2027 if the cash rate climbs past 4.85%.
The threshold where price falls stop helping
The trade-off only works in favour of access if prices fall faster than borrowing capacity contracts. In the current cycle, that’s not happening for most buyers outside distressed pockets.
Consider a $700,000 loan: today’s expected rate rise adds $100 a month in interest. Another two increases add roughly $200 more on top of that. If prices fall 15% but the monthly bill rises $300, the household’s residual cashflow, what’s left after the mortgage, rates, insurance, utilities, shrinks, not expands.
For marginal buyers already stretching to a 30% debt-to-income ratio, that $300 is the difference between pre-approval and rejection. It’s also the difference between paying down principal and refinancing into interest-only just to stay current.
The catch
- A $700,000 loan at 4.35%: roughly $3,880/month in repayments (P&I, 30 years)
- Same loan at 5.1%: roughly $4,180/month, $300 more, every month, for the life of the loan unless rates reverse
- A 15% price fall takes a $700,000 purchase to $595,000, but borrowing capacity may have dropped $90,000-$110,000 by then, depending on income and lender
- Result: the deposit requirement is lower, but fewer households meet the serviceability test, and those who do face higher ongoing costs
Who gets locked out first
First-home buyers relying on dual incomes and maximum LVR see capacity evaporate fastest. A household earning $120,000 combined loses roughly $70,000-$80,000 in borrowing power across two rate rises at current buffer settings, enough to push them out of the lower quartile in most capital-city markets.
Upgraders with existing debt face a different bind: their current property’s value is falling, eroding usable equity, while the next rung up requires a bigger loan at a higher rate. The net effect is either staying put or downsizing.
Investors already carrying multiple properties hit serviceability walls earlier because lenders discount rental income and aggregate all debt. A third or fourth purchase that pencilled in six months ago no longer meets the 5.5% net rental yield threshold most banks enforce at higher rates.
What this means for the supply-demand imbalance
Cheaper prices don’t fix the structural problem, too many households chasing too few properties. Rental vacancy remains below 1% in most metro markets, and rents are still climbing because the marginal buyer priced out of ownership stays in the rental pool longer.
If borrowing capacity keeps falling and prices follow, but construction activity stalls under higher financing costs, the supply shortfall compounds. Developers pulling projects offline today won’t deliver dwellings in 2027-28, which tightens the rental market further and keeps upward pressure on rents, even as property values soften.
That’s the second-order effect: rate hikes intended to cool demand by making debt more expensive also choke off the supply response, locking in scarcity.
Real scenarios over the next six months
Base case: RBA lifts twice more (today and Melbourne Cup day), cash rate hits 4.85%. Median prices fall another 8-12% in Sydney/Melbourne, 5-8% in Brisbane/Perth. Borrowing capacity contracts $80,000-$100,000 for a median-income household. Auction clearance rates stay sub-60%, stock on market rises but doesn’t flood. Rental growth moderates to 4-5% annually but doesn’t reverse.
Downside: A third hike takes the cash rate to 5.1%. Prices fall 15-20%, distressed listings appear in over-leveraged postcodes, clearance rates dip below 50%. Borrowing capacity drops $110,000+, locking out 15-20% of the first-home buyer cohort entirely. Rental supply tightens further as investors exit.
Upside: RBA pauses after today, inflation cools faster than expected on goods deflation and softer wages growth. Prices stabilise, borrowing capacity stops contracting, first-home buyers who saved deposits during the correction re-enter. Clearance rates lift back to 65%, transaction volumes recover modestly in Q1 2027.
Decision points if you’re in the marginal zone
If you’re stretching to maximum borrowing capacity now, model what happens at 5.1% before you exchange. Most lenders’ online calculators let you stress-test repayments, add $300-$400/month to your expected bill and see if your budget holds.
If it doesn’t, either wait for prices to fall further and rates to stabilise, or adjust your target price bracket down now. A $50,000 smaller loan saves roughly $70/month at current rates and gives you a buffer if serviceability tightens again.
For existing owners considering an upgrade: if your equity position is already tight, this is not the cycle to stretch. Wait until borrowing capacity stabilises or your income rises enough to absorb the higher assessment rate.
Borrowing capacity cuts hit $58k: which states lose hardest breaks down how different income bands and states are affected, worth reading if you’re trying to size the gap.
What would change the math
Three things could reverse the affordability crunch without waiting for a full rate-cutting cycle:
- Wage growth acceleration: If household incomes rise 4-5% while rates stay flat, borrowing capacity expands even if the cash rate doesn’t fall. That’s a 2027-28 story at earliest.
- Lender buffer cuts: If APRA allows banks to lower the 3% serviceability buffer to 2.5%, borrowing capacity jumps $40,000-$50,000 overnight. Unlikely while inflation is still above target.
- Supply surge: If 200,000+ new dwellings come online in the next 18 months (current run rate is closer to 160,000), rental pressure eases, vacancy rises, and prices soften faster than serviceability contracts. Possible only if state planning approvals accelerate and construction finance costs fall, neither is happening yet.
Absent one of those shifts, the paradox holds: cheaper doesn’t mean more affordable.
Practical next step
If you’re deciding whether to buy in the next three months, get a formal pre-approval now, not conditional, not indicative, but a full credit assessment with payslips and tax returns. That locks in today’s serviceability test for 90 days and tells you exactly what you can borrow before the next rate move.
If the number is lower than you expected, adjust your search criteria or wait. Stretching into a loan you can barely service today leaves no margin for error if rates rise again or your income changes.
Subscribe to the newsletter for the weekly affordability tracker, we model borrowing capacity shifts by income band and state every time the RBA moves.
General info, not financial advice.