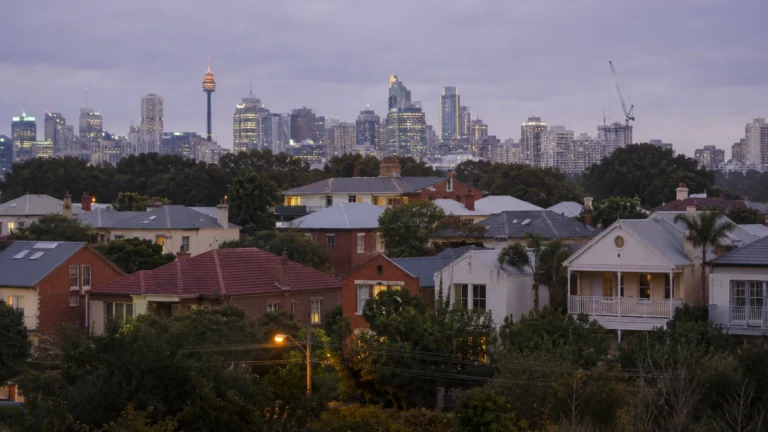
Three rate rises have stripped $70,700 from the typical couple’s borrowing capacity since January. Sydney house prices are forecast to fall $162,000 over the same twelve months. On paper, affordability improves. In practice, fewer people can transact, which explains why sales volumes are running 15-20% below the ten-year average despite the price softening.
The gap between what borrowers can access and what they need to bid has widened, not closed. A fourth rate rise, still possible if core inflation stays sticky, would push the borrowing-capacity loss to $92,500 for couples, more than offsetting the forecast Sydney decline and leaving Melbourne, Brisbane, Perth and Adelaide buyers materially worse off than they were at the start of the year.
How the maths works against buyers
Borrowing capacity is a function of income, existing debts and the interest rate banks use to stress-test loans. Each 25-basis-point rise lifts that assessment rate and shrinks the maximum loan a borrower qualifies for, regardless of the property’s sticker price.
Since February, three rises have cut an average wage earner’s capacity by $35,400. For a couple both earning average wages, the combined hit is $70,700. A fourth rise would add another $10,800 per individual, $21,800 per couple.
The numbers that matter
- Individual borrower (average wage): down $35,400 since January; down $46,300 if a fourth hike lands
- Couple (two average wages): down $70,700 since January; down $92,500 with one more rise
- Sydney median house price: forecast to fall $162,000 over the year to December 2026, but $67,000 of that decline has already occurred, rest expected August onward
- Brisbane, Perth, Adelaide: positive year-on-year, but forecast to fall from August ($28,380, $17,200, $30,754 respectively)
Source: Analysis based on RBA cash rate moves, NAB forecasts, Corelogic median prices.
The catch: Sydney’s forecast $162,000 drop looks larger than the $70,700 borrowing squeeze, but most of that price fall has already happened. From August to December, NAB projects another $67,000 decline, less than what the rate rises have already taken off the table. Buyers chasing that remaining softening still face a narrower borrowing envelope than they had in January.
Where it bites hardest
Sydney and Melbourne borrowers see the price relief, but it doesn’t cover the capacity loss. Brisbane, Perth and Adelaide are worse: prices rose through the first seven months of the year, then are forecast to fall modestly from August. Buyers in those markets paid higher prices during the run-up and now face the same borrowing-capacity haircut without the offsetting Sydney-style decline.
Perth is the starkest example. The forecast shows a $50,300 gain over the full year to December, but that’s already banked. From here, prices are expected to fall $17,200. A couple who locked in a pre-approval in January can borrow $70,700 less now, but the median house price is still $33,100 higher than it was then (net of the forecast $17,200 decline from August). They’re behind on both sides.
Adelaide and Brisbane follow similar arcs: the year-to-date strength leaves current buyers paying more than early-year buyers did, with less borrowing power to fund the difference.
The RBA’s position and what it means for a fourth rise
The Reserve Bank holds today, but core inflation remains above the target band. Headline inflation dropped faster than expected in June, but the bank’s focus is trimmed mean and weighted median, both still sticky. The board has not ruled out further tightening.
If that fourth rise lands, the borrowing-capacity loss doubles down on cities already squeezed. Sydney’s remaining forecast decline ($67,000 from August to December) would be offset by an additional $21,800 cut to what couples can borrow, leaving a net $45,200 improvement, but only if you weren’t active earlier in the year. For anyone who bought or locked in a rate in the first half, the capacity loss is cumulative: $92,500 total.
Melbourne, where the forecast is an $89,600 full-year decline, faces the same dynamic. The price softening doesn’t restore what the rate rises took.
Who this leaves on the sidelines
First-home buyers stretching to maximum borrowing capacity are the most exposed. Investors with equity buffers can absorb the serviceability hit or wait it out. Upgraders with sale proceeds have more room to move. But entry-level buyers relying on dual incomes and tight deposit margins are now priced out of suburbs they qualified for in January, even as those suburbs’ median prices fall.
Transaction volumes reflect this. Listings are up, but clearance rates in Sydney and Melbourne have dropped below long-run averages. The gap isn’t a buyer strike, it’s a funding constraint. Borrowers want to transact but can’t meet the new serviceability tests at current price levels.
What would change the equation
Two things could restore balance: rate cuts or faster price declines.
Rate cuts are unlikely until core inflation convincingly trends back into the 2-3% band. The earliest window for that, based on current forecasts, is late 2026 or early 2027. Faster price declines are possible if forced selling picks up, unemployment rising, fixed-rate rollovers into higher payments, investor cashflow stress, but none of those drivers are dominant yet.
The base case is a slow grind: modest price falls, stable (or one more higher) rates, and a narrow transaction window for borrowers without existing equity.
Start here
If you’re making a call in the next six months, pressure-test your borrowing capacity at 7.5% (roughly one more hike above current assessment rates). If you can’t service the loan at that level, either wait for rates to fall or reset your price ceiling now. Don’t assume price falls will compensate for capacity losses, they haven’t so far, and another rate rise tips the ledger further against buyers.
Existing borrowers: run the numbers on an extra $200-250 per month in repayments if the RBA moves again. If that breaks your buffer, refinance to a lower rate now, 49 lenders are below 6% and the gap between loyalty rates and new-customer rates is still wide enough to matter.
For the weekly signal on what’s moving and what’s noise, subscribe to the newsletter.
General info, not financial advice.