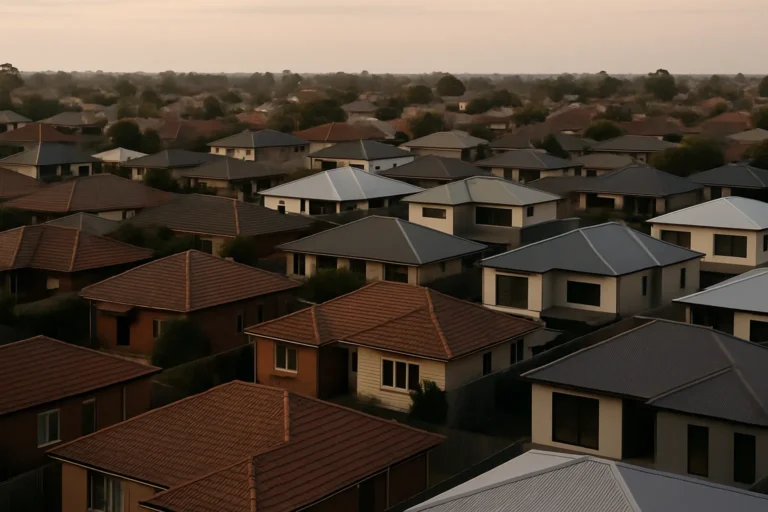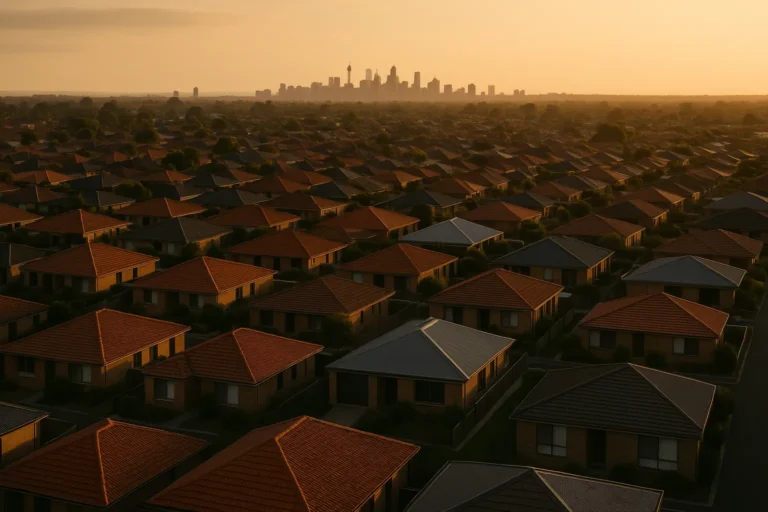
Almost every suburb in Sydney is going down at the same time. That is the detail worth sitting with, more than any national average. Since the May federal budget, house values dropped in only six Sydney suburbs, according to new data from the realestate listings portal’s research arm, while about 97 per cent of them fell.
That is not what a local correction looks like. It is what happens when something common to every borrower and buyer changes at once.
One market, one direction
Across the country, average house values fell in 82.2 per cent of suburbs over the three months since the budget. They rose in 10.6 per cent and were flat in 7.1 per cent. Units told a close cousin of that story: values slipped in 79.7 per cent of suburbs that had data, rose in about 14 per cent and sat still in 6.3 per cent.
In a healthy, supply-driven correction, you would expect pockets of strength. A suburb with a new rail line, a school catchment shift or a tight listing pipeline usually holds up while others sag. When nearly every pocket moves together, the cause is probably not local. Analysts point to a mix of rate rises, overseas conflict and policy change. The budget measures, including limits on negative gearing, sit on top of a rate environment that was already tightening borrowing capacity.
That matters because broad falls and deep falls are different problems.
Breadth versus depth
A headline average can hide the shape of a downturn. Two markets can both be “down 2 per cent” and carry completely different risks. In one, a handful of suburbs fall 10 per cent while the rest are stable. In the other, nearly everything slips a little. The second is the one we are seeing, and its risks are quieter but wider.
For households, the damage shows up as equity. Queensland suburbs hit hardest lost as much as $244,000 in owner equity, with nine in ten suburbs there falling in the September quarter. Greater Brisbane slipped 0.2 per cent in September, a sixth straight monthly decline. A fall that looks small in percentage terms can still be large in dollars when it lands on a high-priced home, and it lands on many homes at once.
Key numbers
- 82.2% of suburbs: house values down since the May budget
- Sydney: only six suburbs with rising house values
- Adelaide: 420 of 462 suburbs down (90.9%)
- Melbourne: 34 of about 400 house suburbs up
What a wide correction does to lender buffers
Banks lend against a valuation, and they stress-test against a fall. When a few suburbs drop sharply, lenders can ring-fence the risk. When almost every suburb drops, there is nowhere to hide collateral. Borrowers who bought recently with a small deposit are the most exposed, because a modest fall can wipe out the gap between the loan and the property’s value.
That does not mean a wave of forced sales. Most borrowers keep paying, and arrears usually lag price falls by many months. But it does mean valuation shortfalls become more likely when someone wants to refinance, switch lenders or release equity. The practical effect is slower: fewer people can move, and fewer move at once.
Who looks closest to a floor
The spread is uneven, and that is where the useful signal sits. Melbourne appears nearest to stabilising. Only 34 of about 400 house suburbs and 28 of more than 280 unit suburbs grew, so it is hardly strong, but its decline looks more advanced. Hobart house values fell between 0.1 and 2.2 per cent in most areas, a gentler slide. Adelaide is moving the other way: 420 of 462 suburbs fell, and only 18 grew.
Sydney is the outlier. House values fell in close to 97 per cent of suburbs and units in 81 per cent. The lack of dispersion suggests a market responding to borrowing costs and tax settings rather than to local supply. If that reading is right, recovery will likely follow the rate and policy path rather than suburb-level fundamentals, which makes timing harder to read from the ground.
Where commentary splits
Coverage of this data has divided along predictable lines. One side treats a broad fall as a sign of fragility, because there is no strong pocket to anchor sentiment. The other reads it as orderly: modest monthly moves, no panic selling, and a market quietly repricing. Both readings can be true. Breadth shows the pressure is shared; the modest size of many falls shows it has not yet turned disorderly. What decides which view wins is employment, rates and the supply of forced sellers, not the headline count.
Investor timing, without the promises
For investors, a broad correction is awkward. There are few suburbs where you can argue the market is rising against the tide, and selling into weakness locks in the loss. Waiting costs holding costs and, under the new tax settings, potentially more. The sensible discipline is to separate the stable from the weak: ask whether a given suburb’s decline is mild and slowing, as Melbourne’s appears to be, or still accelerating, as in parts of Queensland and Sydney.
A rule of thumb: when most suburbs fall together, wait for the number of rising suburbs to grow before reading anything into a single month’s average. A rise in the count of suburbs with gains, from today’s 10.6 per cent, would be an earlier signal than a turn in the national median.
For a read on how this connects to earlier warnings, see our look at how deep the Australian property market correction can go, and our guide to house prices, downturns and auctions.
What could still turn this
The main swing factors are rates, the jobs market and how the budget tax changes bed in. If rate pressure eases, a market this uniform could turn quickly, since the same forces would be working in reverse. If unemployment lifts, the equity loss becomes a cashflow problem rather than an on-paper one. Neither is a prediction. Both are the unknowns that matter most.
Next step
Check your own loan-to-value ratio against a conservative valuation, not last year’s, and know how much buffer you hold before a refinance or equity release would be affected. Then subscribe to the newsletter for the weekly signal on where the data is shifting.
General info, not financial advice.