National dwelling values dropped 0.3% in July, the continuation of a retreat that started when the cash rate climbed past 4% and investor tax treatment tightened. Sydney led capital-city falls at 0.6%, Melbourne shed 0.4%, and Adelaide and Hobart both slipped 0.5%. Darwin was the only capital to post a gain, up 0.1%.
The decline follows three consecutive rate rises earlier this year. The RBA paused at 4.35% in both July and August, but governor Michele Bullock has signalled further tightening remains possible if inflation doesn’t settle. Investors face reduced tax relief on borrowing costs, a structural shift that removes incentive for leveraged buyers who previously absorbed rate rises more easily.
Where the pressure is concentrated
Expensive suburbs and top-quartile properties are falling faster than entry-level stock. This pattern repeats in every rate-driven downturn: stretched serviceability thresholds force upgraders and investors out first, while first-home buyers with smaller loans and government support hold ground longer.
Units are outperforming houses, regional markets are holding flat while capitals slide, and Darwin’s small gain reflects mining-sector wages rather than broad confidence. The divergence tells you this isn’t a liquidity-driven boom reversing, it’s a borrowing-capacity ceiling lowering in real time.
The catch
- Sydney auction clearance rates remain well below year-ago levels despite a modest lift since early June
- Median days on market have stretched by roughly a week nationally since April
- Perth listings jumped 24.3% year-on-year, yet selling times extended from 29 days in April to 40 days in July
- Consumer sentiment climbed to 83.9 in July but still sits in the bottom 10% of its 50-year range
The mismatch driving prices lower
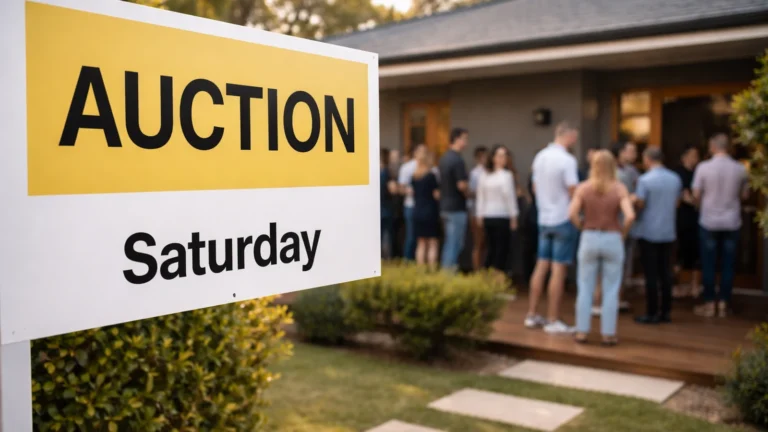
Auction clearance rates improved slightly from June lows but remain soft in Sydney and Melbourne. Low clearance rates signal buyers and sellers can’t agree on price. Vendors anchored to early-2024 comparables are testing the market; buyers with tighter serviceability are walking away or lowbidding. That friction takes months to resolve, usually through vendor capitulation rather than buyer enthusiasm returning.
New listing volumes tell two stories. Sydney and Melbourne saw annual declines of 16.9% and 14.3% respectively, vendors holding off in weak conditions. Brisbane, Adelaide and Perth posted increases, with Perth up 24.3% as interstate migration and local wage growth pulled more stock to market. Nationally, total listings rose 4.2% year-on-year, giving buyers marginally more choice but not enough to offset demand withdrawal.
Tax changes and who they hit
Recent adjustments to investor tax settings removed part of the cushion that let landlords absorb rate rises without selling or pausing purchases. Negative gearing still exists, but tighter depreciation schedules and stricter interest deductibility mean the after-tax cost of holding has risen for leveraged portfolios.
This doesn’t kill investor demand outright, it raises the yield threshold required to justify new purchases and makes marginal properties (those with sub-4% gross yields in expensive suburbs) uneconomic. That’s why premium segments are falling faster: they were disproportionately held by investors chasing capital growth, not cashflow.
Scenarios over the next six months
Base case: prices drift down another 1–2% nationally through year-end as clearance rates stay soft and time on market lengthens. Sydney and Melbourne lead declines; Brisbane and Perth hold or fall minimally. The RBA holds rates unless a data surprise forces another hike.
Upside: inflation falls faster than expected, the RBA signals cuts by early 2025, sentiment lifts, and prices stabilise by October. Probability: 20%.
Downside: another rate rise in September or November, clearance rates drop below 50% in Sydney, vendor panic sets in, and the national decline accelerates to 0.5–0.7% per month through summer. Probability: 25%.
What this means if you’re deciding now
If you’re buying: negotiate hard, especially in premium suburbs. Vendors are adjusting expectations slowly, comparable sales from three months ago are stale. Use days-on-market and clearance data as leverage. Lock in a buffer above the serviceability floor; if rates rise again, you need room.
If you’re selling: price at or below recent comparables in your street, not April peaks. The longer you wait for your number, the more days on market you accumulate, which signals distress and attracts lowball offers. If you need to sell this year, move now before spring stock floods the market.
If you’re holding: review your cashflow buffer. Can you absorb another 0.25% rise and still cover repayments, rates, maintenance? If the answer is tight, model a six-month vacancy or tenant default now, not when it happens.
Red flags through summer
Watch clearance rates in Sydney and Melbourne through September and October. If they fall below 50% for three consecutive weekends, expect faster price declines and forced-sale volume to rise. Monitor RBA minutes for language shifts on inflation persistence, any hint that another hike is likely will pull buyers out immediately.
Regional markets that outperformed during the pandemic (Byron Bay, Ballina, Noosa, Margaret River) are vulnerable if urban buyers stop competing for lifestyle properties. Those areas saw the biggest run-ups on low borrowing costs and remote-work narratives; reversing conditions hit them asymmetrically.
Bottom line
This isn’t a crash; it’s a grind. Borrowing capacity is falling faster than sentiment, so prices adjust in slow motion rather than sudden capitulation. The pain is concentrated in expensive segments, investor-heavy suburbs, and cities where listing supply is rising. If you’re making a decision in the next 90 days, assume another 1% national decline is priced in, and stress-test your assumptions for one more rate rise even if it doesn’t arrive.
Subscribe to the newsletter for the weekly signal on what’s moving and what’s noise.
General info, not financial advice.