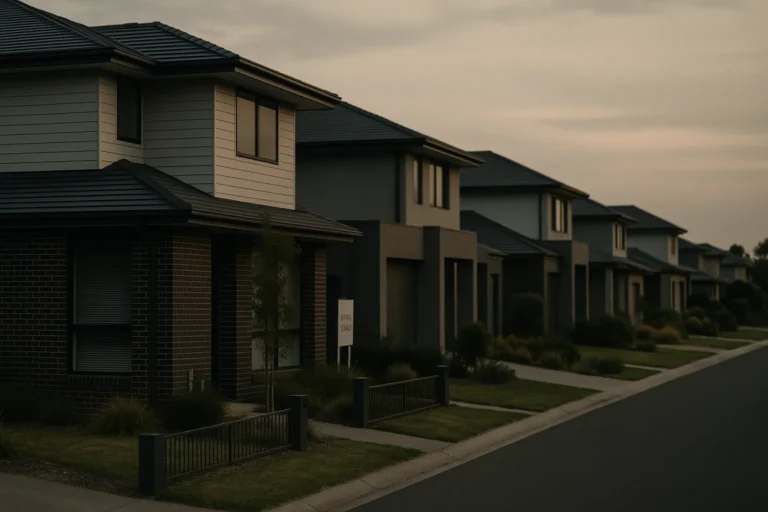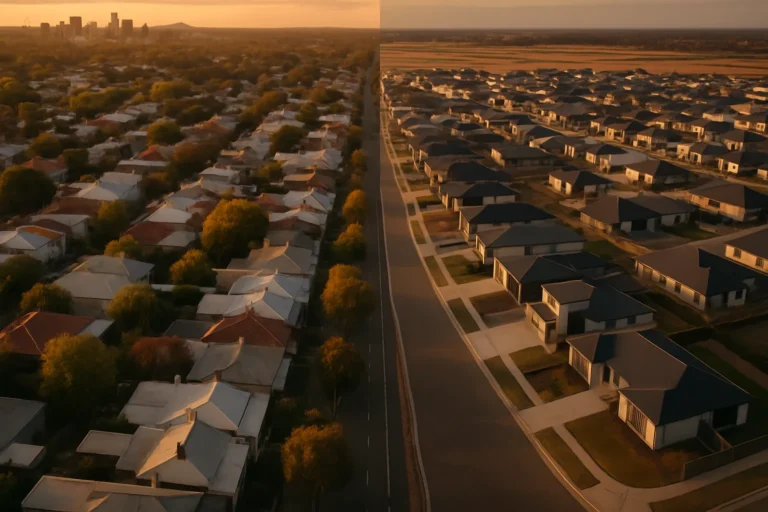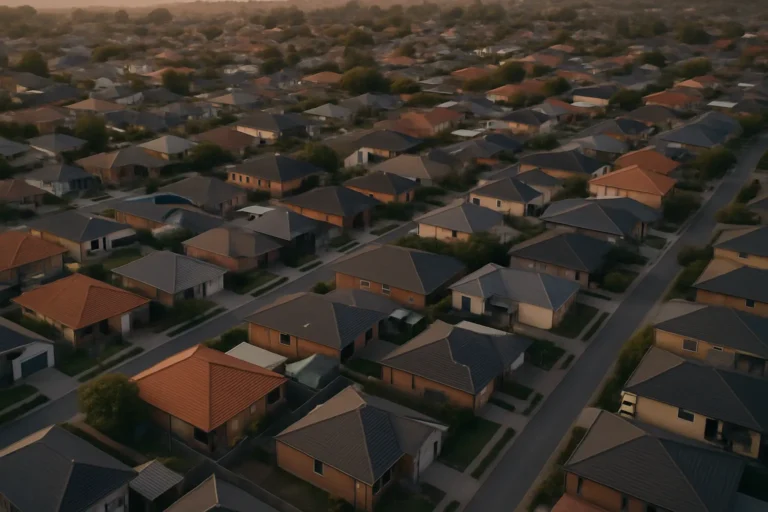
The housing downturn that began in Sydney and Melbourne six months ago has now reached every capital city, marking a shift from patchy regional weakness to a synchronized national correction.
Perth and Adelaide, the two markets that kept rising through the first half of the year, are now recording monthly declines. That matters because it signals the second phase of this correction is driven by credit availability rather than city-specific supply imbalances or affordability ceilings.
What’s different this time
Earlier in the year, price falls were concentrated in the two largest cities. Sydney and Melbourne dropped while Perth and Adelaide kept climbing, buoyed by interstate migration, tight rental markets, and fewer listings.
That divergence has closed. All eight capitals are now posting negative monthly growth, according to the major data providers tracking auction clearance rates, median sale prices, and time on market.
The common thread is tighter lending standards. Serviceability buffers have lifted, income verification has become stricter, and the share of loan applications rejected or downsized has crept higher across all lender types.
The credit constraint
Borrowing capacity has been trimmed by around 8-12% over the past nine months for a typical household with stable employment and a 20% deposit. That’s the result of higher assessment rates (now 3-3.5 percentage points above the actual loan rate) and renewed scrutiny on living expenses.
Investors face sharper cuts. Lenders are pricing rental income more conservatively, applying tougher debt-to-income caps, and requiring larger deposits for second or third properties.
The result is fewer buyers competing at each price point. Auction clearance rates have dropped below 60% in Sydney and Melbourne, and vendor expectations are adjusting downward in markets that were still rising three months ago.
Key numbers
- Serviceability buffer now 3-3.5 percentage points above loan rate, up from 2.5-3 points a year ago
- Borrowing capacity down 8-12% for typical households since mid-2025
- Auction clearance rates below 60% in Sydney and Melbourne
- All eight capital cities recording monthly price declines for the first time this cycle
Regional lenders have picked up some of the volume the majors have shed, but they’re working from a smaller base and applying similar assessment standards. Home lending growth at regional lenders has accelerated, but it’s not offsetting the broader pullback.
Pressure points by city
Sydney and Melbourne are furthest into the correction. Median prices are down 4-6% from their recent peaks, with outer-ring suburbs and apartments showing steeper falls.
Brisbane is holding up better due to ongoing interstate migration and a relatively shallow construction pipeline, but monthly price growth has stalled.
Perth and Adelaide, the standouts six months ago, are now seeing small monthly declines as affordability constraints catch up and the buyer pool narrows. Both cities still sit above their 2024 levels, but momentum has reversed.
Hobart, Canberra, and Darwin are recording modest falls in line with their smaller market size and thinner transaction volumes.
What could change the trajectory
Three scenarios matter for the next six months.
Base case: credit conditions stay tight, the RBA holds rates steady, and prices drift lower by another 2-4% nationally before stabilizing in late 2026 or early 2027. Listings stay elevated through spring, clearance rates hover in the mid-50s, and time on market extends.
Upside case: the RBA cuts rates sooner than expected (Q1 2027 instead of mid-2027), lenders ease serviceability buffers in response, and buyer confidence returns. Prices stabilize by mid-2026, with some markets posting small gains by year-end.
Downside case: unemployment ticks up, forced sales increase, and lenders tighten further. Prices fall 6-10% nationally, with Sydney and Melbourne bearing the brunt. Construction slowdowns compound the credit constraint, delaying any recovery into 2028.
The risk skew tilts toward the base or downside case while lending standards remain this tight and wage growth lags inflation.
Risks to watch
Forced sales remain low for now, but the lag between credit stress and distressed listings is typically 6-12 months. Spring clearance data will show whether vendor expectations have adjusted enough to match current buyer capacity.
Construction activity is slowing across residential and commercial sectors, which will ripple through employment and household incomes in trades-heavy cities like Melbourne and Brisbane. Housing construction slowdown effects are still building.
Investor activity is running at multi-year lows, removing a large slice of price support in markets like Sydney where investors typically make up 30-40% of transactions. If that stays depressed, the trough could be deeper and longer than the base case assumes.
What it means if you’re deciding now
If you’re buying, the next three to six months will likely offer better value than the past 18 months. But timing the exact bottom is hard, and borrowing capacity matters more than price alone. Run your numbers at current rates and buffers before assuming you’ll qualify for what you could six months ago.
If you’re selling, spring will test how far vendor expectations need to fall to meet the current buyer pool. Properties priced within 5% of recent comparable sales are clearing; anything above that is sitting.
If you’re holding, the correction is broad but not uniform. Proximity to employment centres, transport, and schools will outperform outer-ring and regional fringe areas in a credit-constrained market.
Waiting for rate cuts to restore borrowing capacity is a gamble. If the RBA moves in 2027, prices may have already stabilized or started recovering in tightly-held areas.
What to do next
Get a borrowing capacity assessment now, not six months ago. Serviceability rules have changed, and what you qualified for earlier this year may no longer be available.
If you’re considering a spring purchase, track auction clearance rates and median days on market in your target area. When clearance stays below 55% for three consecutive weeks, vendor expectations are adjusting.
If you’re refinancing or considering an investment property, factor in tighter lending standards and lower rental yield assumptions. The gap between what lenders will count and what you think a property will earn has widened.
For weekly analysis on what’s moving markets and what it means for your next decision, subscribe to the newsletter.
General info, not financial advice.