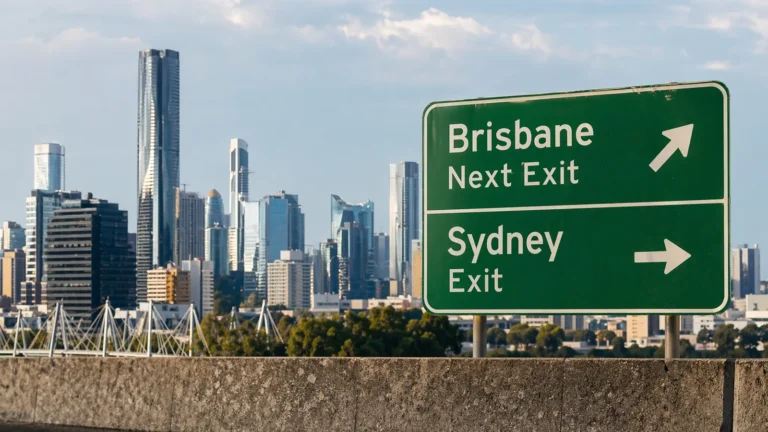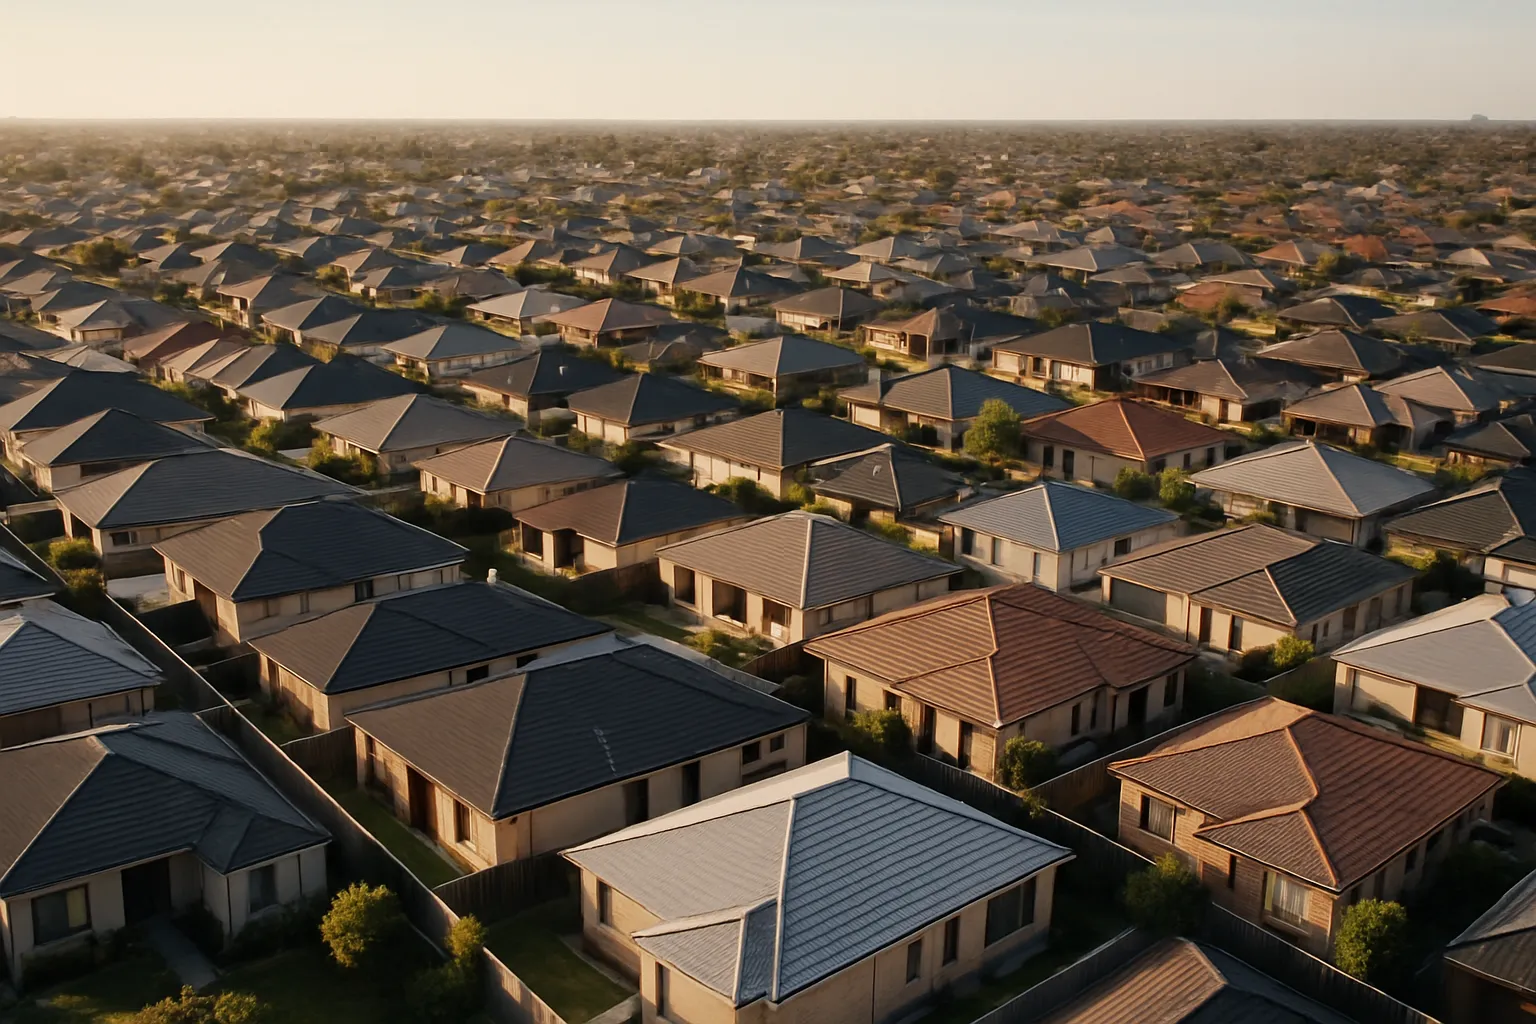
Total housing supply across Australia’s combined capital cities has climbed to its highest level in seven years, according to Domain’s July 2026 data. At the same time, auction clearance rates dropped to 49.1%, the weakest July result since 2005. Auction withdrawals hit 15.9%, a level not seen since April 2020.
The question: is this a structural shift toward buyer-friendly conditions, or a seasonal dip that will reverse when spring arrives?
What the stock numbers show
New listings reached a record high for July. Homes are taking longer to sell, and total stock is building month-on-month. Perth led the charge with monthly supply growth of 23.9% and annual growth of 52.7%. Brisbane followed at 18.3% monthly and 38.3% annually. Sydney, Melbourne and Canberra all posted double-digit annual increases.
Adelaide saw a slight monthly decline of 0.6% despite absorbing record new supply over the past year, still up 13.5% annually. Hobart and Darwin both contracted, down 8.1% and 8.0% year-on-year respectively.
Distressed listings remain historically low across all capitals. The stock build reflects weaker buyer demand rather than forced selling.
Where buyers are gaining ground
Sydney, Brisbane and Canberra are showing the clearest signs of a buyer-friendly shift. In these cities, rising supply is combining with longer selling times and increased vendor discounting.
In Sydney, stock is up 16.4% year-on-year but monthly growth has slowed to 2.6%, suggesting the surge may be stabilising. Brisbane’s 38.3% annual increase is the second-largest among capitals, driven by both new listings and slow absorption.
Canberra’s 15.9% annual rise is modest by comparison, but local selling times have stretched noticeably, giving buyers more room to negotiate.
Perth and Adelaide are outliers. Perth’s explosive supply growth has not dampened price momentum, underpinned by strong interstate migration and a tight rental market. Adelaide continues to absorb elevated new supply without significant price weakness, maintaining its position as one of the stronger capital markets.
The clearance rate collapse
A 49.1% clearance rate in July sits well below the 60% threshold typically considered a balanced market. The last time July clearance rates were this weak was 2005, when the market was unwinding from an earlier boom.
Auction withdrawals at 15.9% are the highest since the pandemic lockdown months of April 2020. Vendors pulling properties before auction day signals uncertainty about achieving reserve prices in current conditions.
This is happening despite the RBA holding the cash rate steady for the second consecutive meeting. Rate stability has not translated into buyer urgency.
Key numbers
- Combined capitals total supply: highest level in seven years
- July auction clearance rate: 49.1%, weakest since 2005
- Auction withdrawals: 15.9%, highest since April 2020
- Perth annual supply growth: 52.7%
- Brisbane annual supply growth: 38.3%
The interest rate factor
The RBA held rates in July, with inflation data reducing the urgency for further tightening. Market consensus now expects the first cash rate cut in mid-2027, not earlier.
That timeline matters. Buyers waiting for rate relief have another 10-12 months to wait, minimum. Affordability remains stretched, and rising supply is not being met with rising buyer capacity.
Vendors who listed expecting a rate-cut bounce before spring may need to recalibrate. The data suggests buyers are not preparing to compete harder; they are pulling back.
This dynamic is most visible in cities where investor lending has contracted sharply. Bank profit margins are expanding as investor loan volumes collapse 28%, removing a key source of auction-day competition.
Risks that could reverse the trend
Three scenarios could shift conditions back toward vendors:
-
Spring supply shock fails to materialise. If vendors hold off listing due to weak winter clearance rates, spring stock levels may not build as expected, tightening supply again.
-
Rate-cut expectations pull forward. Any hint from the RBA that cuts could arrive earlier than mid-2027 would bring buyers back quickly, especially first-home buyers on the sidelines.
-
Migration sustains rental tightness. Perth and Adelaide show how strong rental demand can support prices even when supply surges. If migration stays elevated nationally, rental yields may keep investor buyers active.
The opposite risk: if supply continues building into spring and clearance rates stay weak, vendors face a choice between price cuts or extended time on market. Political pressure is already building in marginal seats where the downturn is most pronounced, which could influence policy responses heading into 2027.
What this means for decisions now
Buyers have the strongest negotiating position in years across Sydney, Brisbane, Melbourne and Canberra. Rising stock, longer selling times and high withdrawal rates all point to vendor flexibility.
Start with comparable sales from the past 60 days, not listing prices. Withdrawn auctions often relist at lower expectations. Days on market is rising, so there is less urgency to bid at the upper end of your range on day one.
Vendors face a tougher call. Listing now means competing with the highest stock levels since 2019, but waiting for spring may not improve conditions if supply keeps building. Price realistically or expect extended campaign periods.
Investors should check city-specific supply pipelines. Perth and Adelaide are absorbing record new stock without pricing weakness due to rental tightness, but Brisbane and Sydney are seeing both rising supply and weakening tenant demand in some segments.
Subscribe to the weekly newsletter for ongoing coverage of supply trends, clearance rate movements and vendor behaviour heading into spring.
General info, not financial advice.