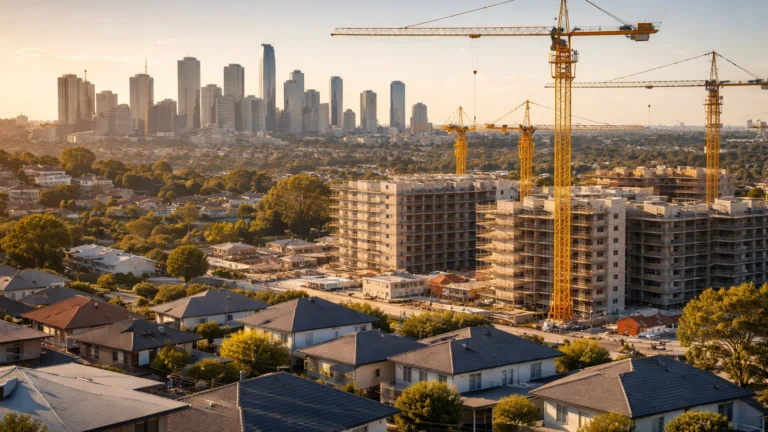
The June quarter produced a contradiction: investors committed a record $5.994 billion to building new homes, up $1.32 billion year-on-year, while the broader investor loan pool contracted by 5,000 approvals. Tax policy reshaped the split, but construction activity is now moving the other way.
Australian Bureau of Statistics figures show 8,468 investor loans for new dwelling construction in the three months to June, beating the previous quarter’s record by 454 approvals. At the same time, investor appetite for established property collapsed, creating the widest divergence on record between new and resale capital flows.
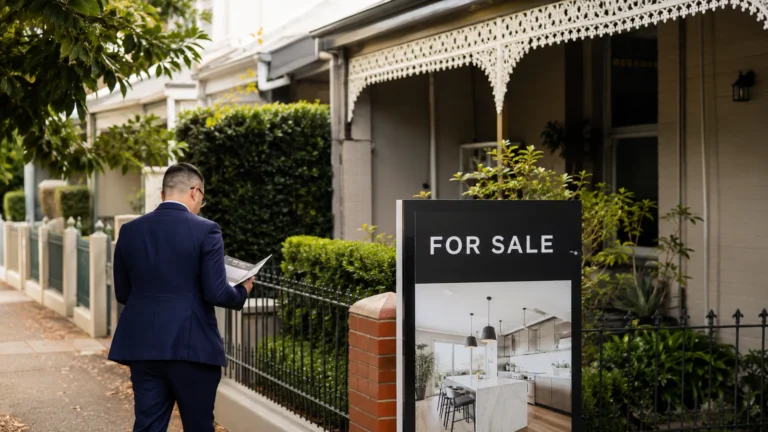
The shift follows federal budget changes that restrict negative gearing and the 50 per cent capital gains tax discount to new builds only. Investors who want the tax concessions now have one path: construct a dwelling that adds to supply.
Why loan approvals surged while construction stalled
The June quarter captured decisions made before and immediately after the May budget announcement. Broker application data from one national network shows investor share of new build loans peaked at 7.38 per cent nationally in June, up from 5.14 per cent twelve months earlier. Victoria hit 11.23 per cent in May.
By July, that share had retreated to 6.01 per cent nationally, and construction sales recorded their third consecutive monthly decline, down 3.7 per cent in July alone, according to Housing Industry Association tracking.
The loan approvals measure intent; the sales data measures contracts signed. The gap suggests some of the capital committed in June is now hesitating, waiting for rate cuts or reassessing build timelines in a softening market.
The capacity question no one’s answering
Record capital doesn’t guarantee record supply. The construction industry is running below the 240,000 annual dwelling starts needed to meet the government’s 1.2 million home target over five years. Labour shortages, material lead times, and planning bottlenecks mean more investor money can bid up land and input costs without lifting completions.
Broker networks report growing interest in dual occupancy and knock-down-rebuild projects in established suburbs, where investors can access the tax settings by replacing one dwelling with two. That adds supply on paper, but the net gain is one home per site, half the density of a typical townhouse subdivision and a fraction of what medium-density zoning permits.
If investors cluster in these marginal-supply strategies rather than greenfield volume developments, the policy delivers the tax concession without the intended supply uplift.
Who’s still building and where
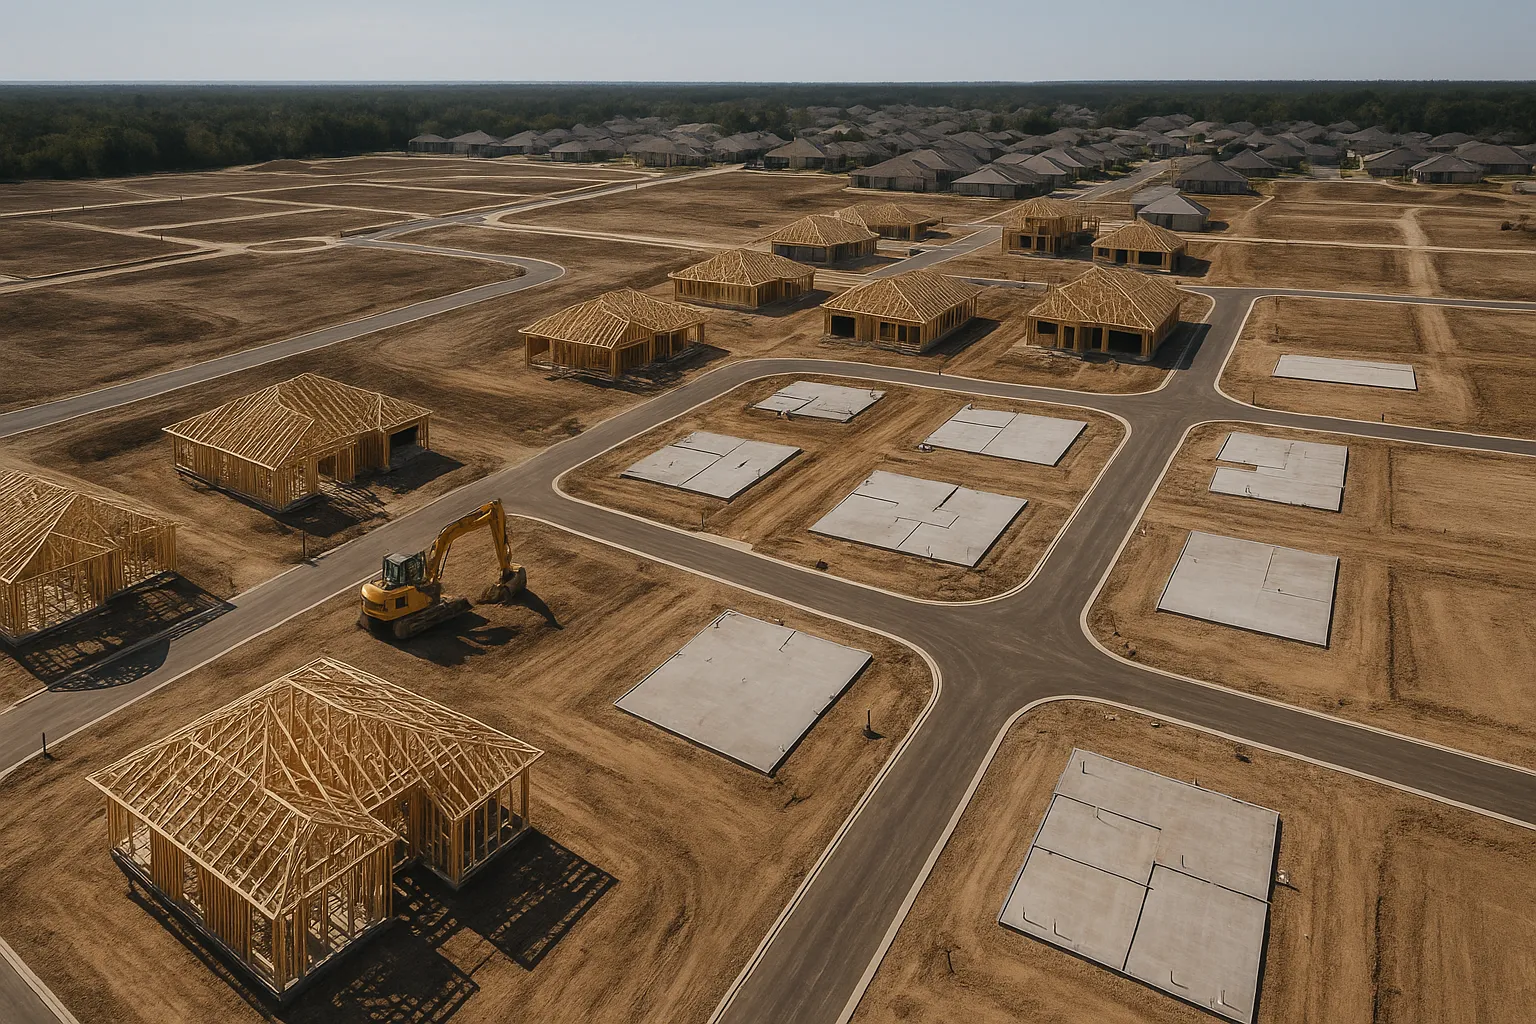
Postcode-level data shows investor new build lending concentrated in outer-growth corridors: house-and-land estates where off-the-plan contracts lock in fixed prices. These areas also map future rental demand, as investors chase yield in suburbs where tenants will relocate when affordability forces the next wave of displacement.
Victorian investors hold the highest share of new build lending nationally, likely reflecting state-level stamp duty concessions and higher land costs that make the federal tax settings more material to cashflow. South Australia and Queensland show rising but volatile shares, consistent with interstate migration flows and relative land affordability.
The established housing market, where investor loan volumes fell sharply, is now showing signs of broader weakness across capital cities, which may keep some capital on the sidelines regardless of tax settings.
Scenarios: base case and the downside
Base case: construction sales stabilise as interest rate cuts materialise later this year, confidence lifts, and investor share of new build lending climbs toward double current levels as tax settings bed in. Supply increases modestly, mostly in greenfield estates, but not enough to meet the 1.2 million target without faster planning approvals and expanded labour capacity.
Downside: rate cuts disappoint or arrive later than expected, established market prices resume falling, and investors pull back from new builds despite tax incentives. The policy drives capital into low-net-supply strategies (knock-down-rebuild, dual occupancy) that deliver tax benefits without volume, and the construction pipeline shrinks further.
The risk is that tax policy reshapes capital allocation without addressing the binding constraints, skills, materials, planning speed, that determine how many homes actually get delivered.
Risks to watch
- Construction sales trend over the next two quarters (do contracts follow loan approvals, or does the gap widen?)
- Investor share of dual occupancy vs greenfield volume projects (marginal supply vs genuine additions)
- Rate cut timing and size (does confidence return before lenders tighten serviceability further?)
- Land banking behaviour in growth corridors (does investor capital sit idle waiting for capital gain?)
What this means for your next decision
If you’re an investor considering a new build to access negative gearing: model the numbers assuming construction takes 12-18 months, interest rates stay higher for longer than current market pricing, and rental yields in outer suburbs compress if supply in those postcodes lifts faster than tenant demand. Budget a cashflow buffer of at least six months’ holding costs beyond practical completion.
If you’re tracking the supply side: watch whether investor capital flows into projects that break ground within 12 months, or into land holdings and off-the-plan contracts that can be flipped or delayed. The loan approvals tell you where the money went; the construction starts data, due next quarter, will tell you whether it’s turning into actual dwellings.
Subscribe to the newsletter for the next update when Q3 construction and loan data land.
General info, not financial advice.