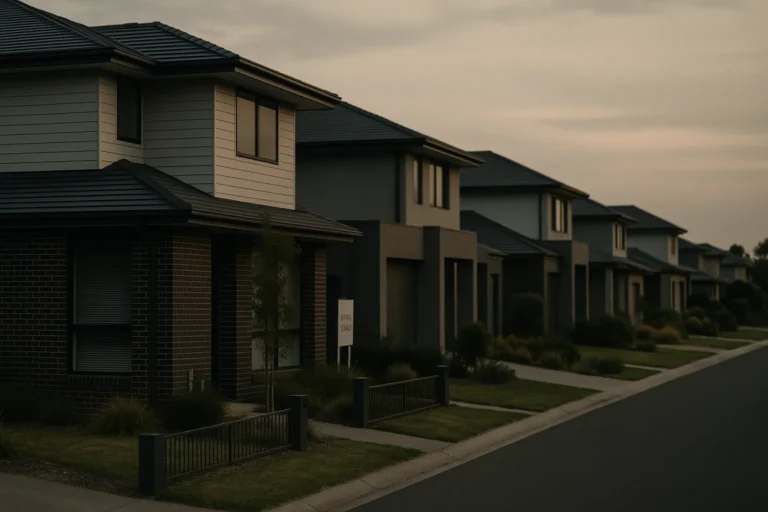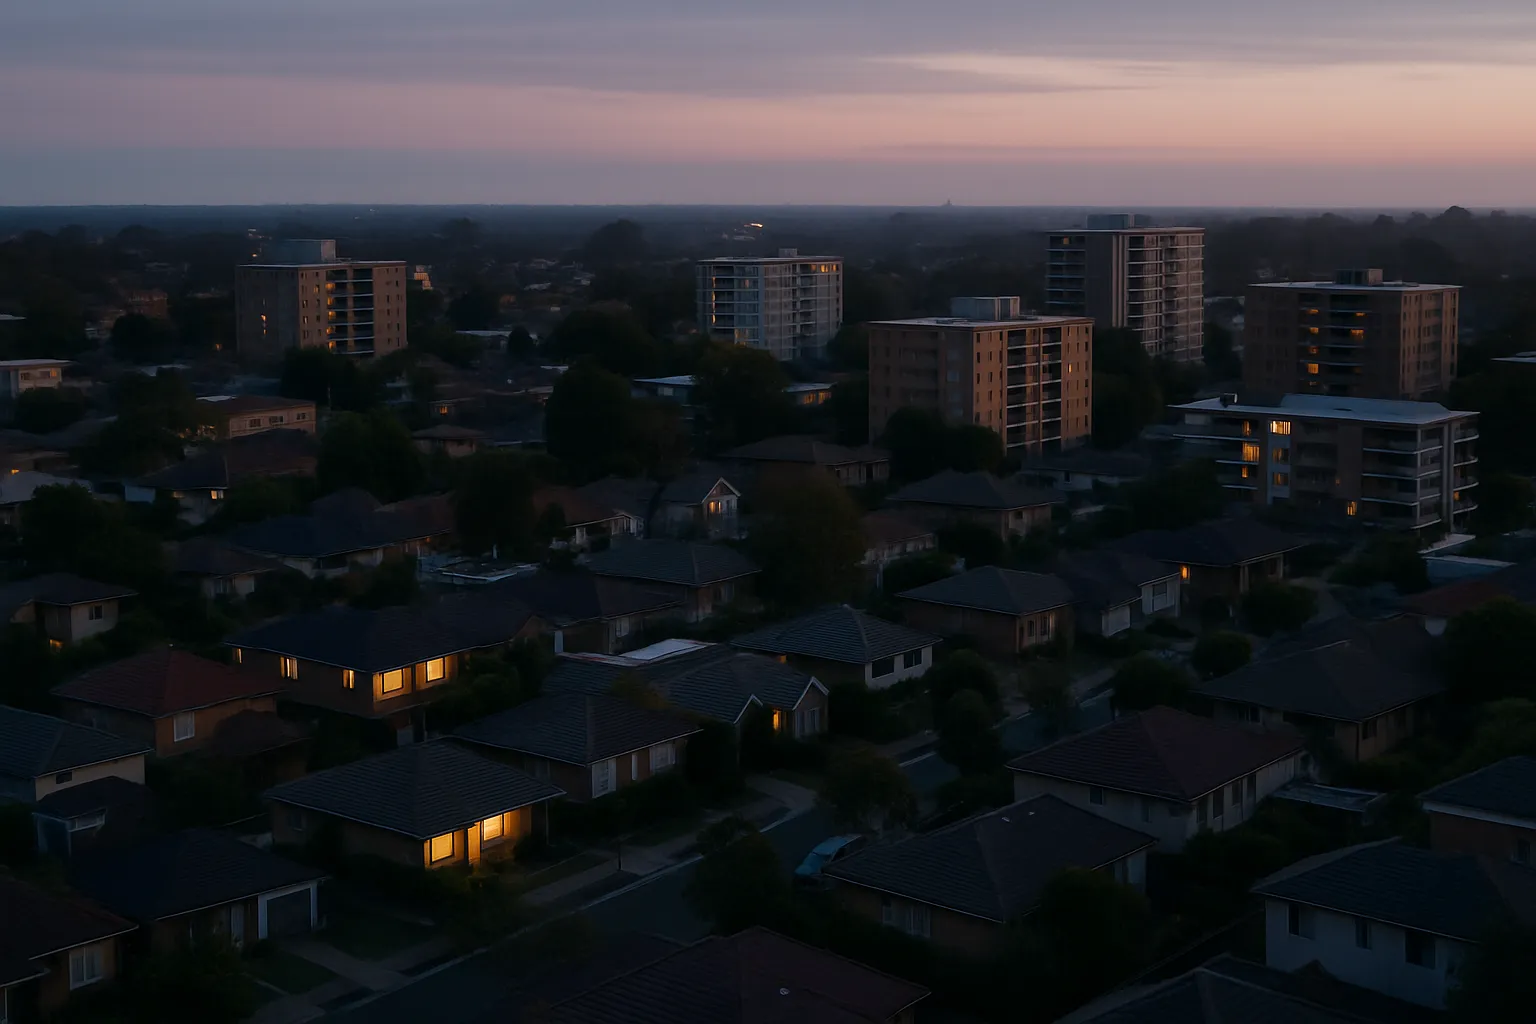
The share of Australian house resales returning a profit has dropped for the first time since early in the pandemic, slipping from 97.5% to 97.4% between the second half of 2025 and the first half of 2026. The shift is small, but it breaks a multi-year trend. At the same time, median resale profits climbed to record levels: $458,000 nationally for houses, $558,000 across capital cities, and $739,500 in Sydney.
That divergence tells the real story. Most sellers who bought years ago are still locking in substantial gains, but a growing minority, particularly recent buyers and unit owners in softer markets, are struggling to break even.
The hold-period divide
Sellers who held property for a decade or more continue to profit heavily. The median gain reflects this cohort: people who bought before or during the early 2010s slowdown and rode the 2020-2023 surge. The data doesn’t break down profit by purchase year, but the pattern is clear when you map holding periods against price cycles.
Anyone who bought in late 2021 or 2022, near the last peak, faces a different equation. Prices in most capitals have either stalled or pulled back since then. If you bought a Sydney house for $1.4 million in early 2022 and it’s now worth $1.35 million, you’re underwater before stamp duty and selling costs. That scenario is rare for houses but increasingly common for units, especially in Melbourne.
Melbourne units: the outlier
More than one in four Melbourne unit sellers, 27%, sold at a loss in the first half of 2026. That’s the highest loss rate of any capital and any dwelling type. The city’s unit market has been under pressure from oversupply in inner-city apartment precincts, weak rental yields, and a construction pipeline that kept adding stock through the downturn.
Canberra also recorded elevated loss rates for both houses and units, driven by public-sector job cuts and population outflows. Brisbane, by contrast, saw 99.5% of unit resales turn a profit, the strongest result nationally. Perth led the house market at 99.6% profitability, buoyed by interstate migration and a supply shortfall that has kept prices rising even as the east-coast markets softened.
The geographic split matters because it affects refinancing risk. A Melbourne unit buyer from 2022 who needs to refinance in 2026 or 2027 may find their property is worth less than they owe. That limits their ability to switch lenders, negotiate better rates, or access equity for other purposes. Negative equity risk: who’s exposed and what it takes to tip covers the mechanics in detail.
The refinancing squeeze
Refinancing typically requires a loan-to-value ratio below 80% to avoid lenders mortgage insurance and access competitive rates. If you bought with a 10% deposit in 2021, you started at 90% LVR. If your property value has dropped 5-10%, you’re now at or above 95% LVR when factoring in the original loan balance minus repayments. That locks you into your current lender, who has no incentive to offer you a better deal.
The Reserve Bank’s household balance sheet data shows mortgage debt levels remain elevated relative to pre-2020 norms, even as property values have plateaued or declined in some segments. The combination creates a cohort of borrowers who are equity-poor but cashflow-constrained, unable to sell without crystallising a loss and unable to refinance without a capital injection.
Where the numbers point next
The slip in profit share from 97.5% to 97.4% is directional, not decisive. If it continues over the next two reporting periods, it signals a genuine shift. If it reverses, it was noise. Three factors will determine the path:
- Interest rate trajectory: If the RBA cuts rates in the second half of 2026, borrowing capacity improves and some stalled buyers return. If rates hold or rise, the pressure on recent buyers intensifies.
- Migration and supply: Perth, Brisbane and Adelaide are still running supply deficits relative to population inflows. Melbourne and Sydney have the opposite problem in parts of the unit market. That divergence is likely to widen before it narrows.
- Forced selling: Job losses, divorce, health shocks and other life events drive a baseline level of distressed sales every year. If unemployment ticks up or mortgage stress accelerates, the share of loss-making sales will climb faster.
The risk is asymmetric. Sellers who bought before 2020 have deep equity buffers and can afford to wait out soft conditions. Sellers who bought in 2021-2022 with thin deposits and variable-rate loans have no buffer and limited time. The data is starting to capture that split.
Profit versus return
Median profit figures are useful for headlines but misleading for decisions. A $739,500 gain in Sydney sounds large until you account for the median holding period (around nine years), the initial purchase price (likely $900,000-$1.1 million in 2017), and the carrying costs (interest, rates, maintenance, insurance). The annualised return after costs is closer to 5-6%, not the double-digit figure the raw profit number implies.
Units fare worse. The national median unit profit of $237,000 is roughly half the house figure, but the median unit holding period is similar. Lower capital growth, higher body corporate fees, and weaker rental yields compress returns further. In Melbourne, where 27% of unit sellers are losing money outright, the effective return for many others is near zero or negative once costs are factored in.
The catch
Record median profits reflect the winners, not the market. A small but growing share of sellers are locked in or losing money, and they’re concentrated in specific segments: recent buyers, units, and weaker capitals. That group is invisible in the median but visible in refinancing queues and distressed-sale listings.
What to watch
Three indicators will clarify whether this is a blip or a turn:
- Loss-making resale share in H2 2026: if it ticks above 3%, the trend is real.
- Melbourne unit listings and days on market: rising supply without rising absorption means more sellers capitulating at lower prices.
- Mortgage stress and arrears data: the Australian Prudential Regulation Authority’s next quarterly update will show whether repayment buffers are eroding.
If you bought in the last three years and you’re considering selling, model the scenario where you break even or take a small loss. Factor in agent fees (2-3%), marketing costs, and any gap between your loan balance and the likely sale price. If the gap is manageable and you need to move, act before conditions deteriorate further. If you can hold, the question is whether your cashflow can sustain another 12-24 months of flat or falling values.
House prices falling Australia: why the government won’t call it a win explores why policymakers stay quiet even when prices soften.
Start here: if you bought since 2021, calculate your current LVR and work out whether you can refinance without additional equity. If not, model how long you can hold if values stay flat or drop another 5%. That’s the buffer that matters now.
Subscribe to the Australian Property Review newsletter for weekly analysis of what’s shifting and what it means for your decisions.
General info, not financial advice.