Sydney’s property market doesn’t move as one block. Some suburbs lifted 15-20% while others slid or flatlined, and the difference isn’t random. Three structural factors separate risers from fallers: proximity to new or announced transport, active rezoning that shifts density expectations, and demographic waves that pull demand into areas previously off the radar.
The pattern holds across cycles. Suburbs that capture two of those three tend to outperform the metro median. Suburbs with none of them – or with countervailing pressures like apartment oversupply or stretched borrowing capacity among existing owners – tend to lag or correct.
What lifts a suburb before others notice
Transport infrastructure moves prices before the first train runs. Announcements alone shift buyer attention, because access determines commute tolerance and employment reach. Western Sydney corridors near planned metro extensions have seen inquiry volumes double even while broader sentiment cooled. The effect compounds when zoning changes follow – councils remap density around future stations, developers lodge plans, and the supply story changes before a shovel hits dirt.
Rezoning itself is a price lever independent of transport. When a low-density pocket gets upzoned for townhouses or mid-rise apartments, land value per square metre reprices immediately. Existing owners gain, new buyers pay the premium, and the gap between that suburb and similar ones without rezoning can widen 10-15% in a year. The risk: if developers flood the zone with new stock faster than absorption, the premium evaporates and sometimes reverses.
Demographic momentum is the third factor. Inner-ring gentrification, migrant settlement patterns, downsizer clusters – each creates localised demand that doesn’t show up in city-wide averages. A suburb pulling young families from adjoining areas will tighten faster than one losing them, even if credit conditions are identical. Migration data and school enrolment trends are early signals here, usually six to twelve months ahead of price moves.
Why some suburbs slide while the market holds
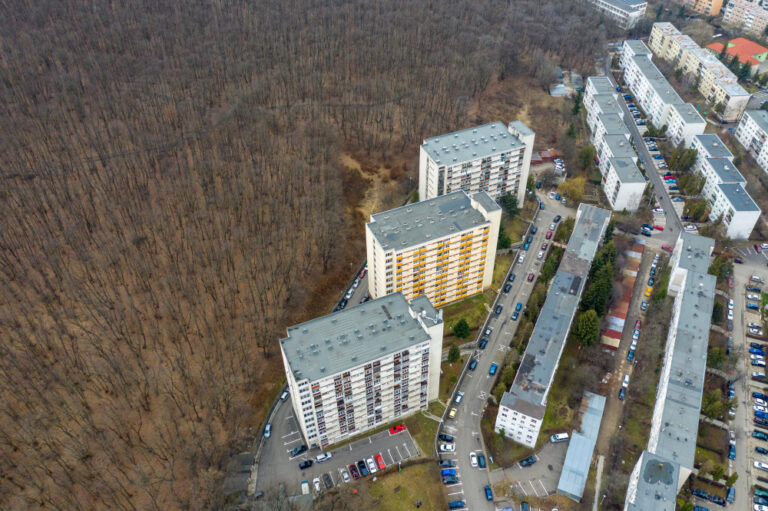
Underperformers typically face one of two structural headwinds: oversupply or over-leverage. Apartment precincts with three years of settlement pipeline still working through often see prices fall 5-10% even when houses in the same postcode hold steady. Buyers know there’s more stock coming, so they wait or negotiate harder. Developers who pre-sold at higher prices two years ago are now competing with their own unsold inventory, and that shows up as price weakness before it shows up in default headlines.
Over-leverage is harder to see in the data but shows up in selling behaviour. Pockets where buyers stretched serviceability limits in 2021-22 – using low rates to borrow at the edge of capacity – are more likely to see forced sales when life changes or rates reset. Those sales set comparables, and the next seller has to match or undercut. It’s not a crash, it’s a slow grind that persists until either rates fall or enough weak hands exit.
The two pressures can overlap. An apartment precinct where buyers used maximum leverage and developers are still settling new towers faces both supply and distress risk at once. Those suburbs can lag the metro median by 15-20% over two years, and the gap doesn’t close until supply clears or rates drop enough to restore serviceability buffers.
The persistence question and mean reversion risk
Outperformance and underperformance rarely last more than three years without a catalyst refresh. A suburb that ran 20% ahead on a rezoning story will stall if no new projects lodge or if the next council pulls back density approvals. A laggard that corrected 10% on oversupply will stabilise once absorption catches up, and sometimes it snaps back faster than the leaders because it’s cheaper and the structural problem is temporary.
Mean reversion is real but not automatic. It requires either the outperformer losing its edge (transport project delays, zoning reversals, demographic shift) or the underperformer clearing its headwind (supply absorbed, distressed sellers exited, rates easing enough to restore confidence). Until one of those happens, the gap can widen further. Betting on reversion without watching the underlying mechanics is how buyers overpay for “value” that stays cheap.
The million-dollar suburb migration pattern shows this in action – price leadership moves outward in waves, and yesterday’s laggard becomes tomorrow’s growth story when its turn arrives. Timing that turn requires watching infrastructure approvals, DA lodgements, and migration flows, not just comparing medians.
Red flags worth tracking now
Three risks could flip today’s outperformers into tomorrow’s laggards. First: infrastructure delays. Announced transport projects that slip timelines by two or three years often see the price premium they created evaporate within six months of the delay announcement. Buyers who paid for 2026 access don’t wait patiently for 2029.
Second: rezoning backlash. Councils face political pressure to pull back density approvals when local opposition organises. A suburb priced for upzoning that sees the council reverse or water down those plans will correct, sometimes sharply, because the land value assumption breaks. This is playing out in parts of the inner west now.
Third: credit tightening that hits specific cohorts. If banks pull back on high-LVR lending or tighten serviceability buffers again, suburbs where buyers rely on maximum leverage – often the same ones that outperformed on affordability grounds – will see demand drop faster than areas where buyers have larger deposits and income buffers. Watch mortgage funding trends for early signals.
The practical read
If you’re comparing suburbs, map the three structural factors – transport, zoning, demographics – and score each one honestly. A suburb with two out of three and no major oversupply or leverage risk will likely hold or extend its lead over the next 12-18 months. A suburb with none of the three, or one with strong countervailing pressure, will likely lag or correct unless rates fall enough to lift all boats.
Don’t assume outperformance or underperformance is permanent. The market reprices structure, and structure changes. A laggard that clears its oversupply or sees a rezoning announcement can turn quickly. An outperformer that loses its catalyst or faces a supply wave can stall just as fast.
In plain English:
Sydney’s property price gaps come down to three things: is new transport coming, is the council rezoning for more density, and are people moving in or out? Suburbs with two of those three tend to win. Suburbs with none – or with too many apartments settling or too many stretched borrowers – tend to lose. The gap lasts until something changes, so watch the pipeline and the policy, not just last quarter’s median.
Start here: before you buy or sell, check the local council’s planning portal for DA lodgements and zoning changes, and cross-reference state transport maps for announced projects. If the suburb scores poorly on all three and has a three-year apartment settlement pipeline, wait. If it scores well and has no major supply overhang, act within your budget and serviceability.
Subscribe to the weekly signal for infrastructure approvals, zoning changes, and migration data that move ahead of price moves.
General info, not financial advice.