More than 2,100 Australian suburbs now carry a median house price above $1 million, and 151 joined that list between January and June 2024. The geographic split tells the story: Queensland claimed 46 of those new entries, Western Australia 37, South Australia 34, New South Wales 31. Victoria added one. Tasmania zero.
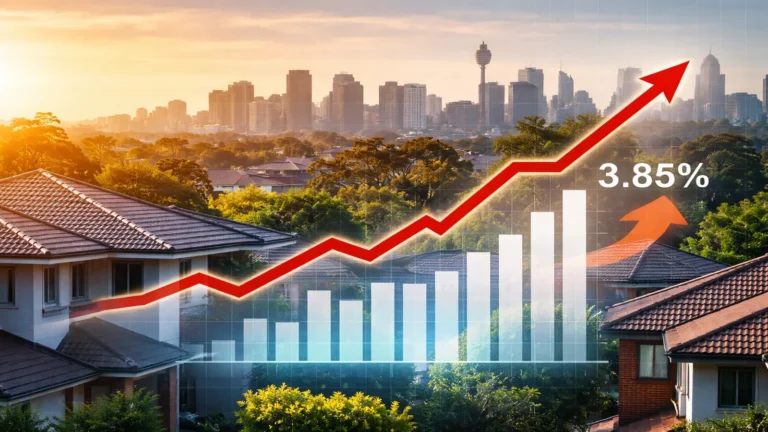
The national median house price sat at exactly $1 million in June, up 5.6% year-on-year according to PropTrack data. But the new million dollar suburbs are clustering in markets that have seen the sharpest appreciation since 2020, not necessarily the cities with the highest absolute prices today. Brisbane, Perth and Adelaide all crossed the million-dollar median for houses in the past 18 months. Darwin added Stuart Park in May. Melbourne, by contrast, is cooling.
New South Wales: outer Sydney and regional centres split the additions
Thirty-one NSW suburbs crossed the threshold. Roughly half sit in Sydney’s outer fringe (Campbelltown, Claymore, Currans Hill, Raby, Rosemeadow, Thirlmere, North St Marys, Windsor), the other half in the Central Coast catchment and Newcastle-Lake Macquarie corridor (Berkeley Vale, Hamlyn Terrace, Woongarrah, Belmont North, Boolaroo, Cameron Park, Fletcher, Macquarie Hills, Mayfield West, North Lambton). Two Illawarra suburbs (Horsley, Oak Flats) and a handful of Hunter Valley towns (Chisholm, Medowie, Millfield) round out the list.
The common thread: these are not prestige postcodes. They are working-class or lower-middle-income areas where a freestanding house on a standard block now costs what an inner-city apartment did five years ago. Downsizing property market stalls as retirees pull 5.5 million homes off the table shows one reason supply has stayed tight in these outer rings: older owners who might have sold and moved closer to services are delaying that decision, removing stock that first-home buyers and upgraders would have competed for.
Queensland’s 46 new entries: the suburbs buyers once skipped
Queensland’s list is the longest and the most revealing. Suburbs like Richlands, Darra, Doolandella and Camira in the Ipswich corridor now carry seven-figure medians. So do Bracken Ridge, Bald Hills and Deagon in Brisbane’s northern arc, and Redcliffe, Margate, Clontarf and Narangba in Moreton Bay. North Lakes, a master-planned estate that was marketed as affordable family territory a decade ago, hit $1.03 million.
Further out, the Gold Coast hinterland added Lower Beechmont, while Ormeau and Ormeau Hills on the northern Gold Coast fringe both crossed over. The Sunshine Coast contributed Burnside, Caloundra West, Palmview and Sippy Downs. Toowoomba added East Toowoomba and Kleinton. Cairns added Freshwater and Goldsborough. Even Wide Bay (Innes Park, Nikenbah) and Mackay-Isaac-Whitsunday (Richmond) posted new entries.
The pattern: these suburbs were either written off as too far, too new or too regional five years ago. Buyers who could not afford established middle-ring suburbs in Brisbane moved out, and prices followed demand. The question now is whether those gains reflect genuine long-term demand (employment, infrastructure, liveability) or the tail end of a boom driven by rate cuts, fiscal stimulus and a brief window when regional migration looked permanent.
Western Australia and South Australia: price doubling since 2020
Western Australia added 37 suburbs to the million-dollar club, South Australia 34. Both states have seen house prices more than double since the start of the decade, driven by interstate migration, undersupply and a mining-driven wage floor that kept serviceability higher than the eastern seaboard.
Perth’s new entries span the inner-middle ring and newer estates. Adelaide’s additions include established southern and northern suburbs that were solidly sub-$700,000 as recently as 2021. The speed of appreciation in both cities has been faster than Sydney or Melbourne experienced during their post-2012 run, compressed into a shorter window.
The catch: both markets are now showing early signs of slowing. Listing volumes are rising, clearance rates softening, days on market extending. Housing market outlook slashed to flat as tax shock accelerates slowdown outlines the broader headwinds (serviceability constraints, tax changes, wavering sentiment) that will test whether these new million-dollar medians hold or slip back below the line in the next 12 months.
Victoria and the ACT: one suburb each
Victoria added one suburb. The ACT added one. Melbourne’s median house price is still above $1 million citywide, but the market has been cooling since mid-2022, and very few suburbs on the fringe or in regional Victoria have had the momentum to cross the threshold this year. The contrast with Queensland, WA and SA is stark.
This is not a temporary blip. Melbourne’s price growth has lagged every other mainland capital for two years. The reasons are well-documented: oversupply of apartments in the inner city, weaker migration flows post-pandemic, higher unemployment in construction and retail, and a municipal political environment that has made new housing supply harder to deliver in the middle ring where families actually want to live.
Which of these 151 suburbs will stay above $1 million
The PropTrack data captures a snapshot at June 2024. The question for investors and upgraders is: are these suburbs million-dollar markets because of structural demand (jobs, schools, transport, land scarcity), or did they cross the line because everything rose together and the line itself moved down to meet them?
Three scenarios over the next 12 months:
Base case: national house prices stay flat to slightly negative through the end of 2024, then recover slowly in 2025 as the RBA stabilises rates and sentiment improves. Most of the 151 suburbs hold their medians above $1 million, though a handful (particularly in WA and SA where gains were sharpest) slip back below for a quarter or two before recovering.
Downside case: if serviceability tightens further (tax changes reduce borrowing power, unemployment rises, or the RBA holds rates higher for longer than markets expect), 20 to 30 of these suburbs could fall back below the threshold. The most vulnerable: outer fringe estates with long commutes, limited local employment and high mortgage leverage among recent buyers.
Upside case: if rate cuts arrive earlier than expected and migration picks up again in 2025, the 151 could become 200-plus by mid-2025, with the next wave concentrated in regional Queensland, Adelaide’s northern corridor and Perth’s southern growth belt.
None of these scenarios is locked in. The variable that matters most is serviceability: can household income in these suburbs support a $1 million median house price when mortgage rates are above 6%? For some (mining towns, professional-class commuter belts, retiree destinations with cash buyers), yes. For others (outer estates with high unemployment, long commutes and young mortgaged households), the answer depends on wage growth keeping pace with holding costs.
What this tells you about where affordability pressure moves next
The 151 new million-dollar suburbs are not a sign of a healthy, balanced market. They are a map of where affordability pressure has migrated as buyers get pushed further out. Ten years ago, a million-dollar suburb meant harbourside Sydney, inner Melbourne, or Brisbane’s best school catchments. Today it means Claymore, Doolandella and Mayfield West.
That migration has consequences. Longer commutes mean higher transport costs and less time at home. Outer suburbs often lag on infrastructure (trains, hospitals, high schools built for half the current population). Employment is thinner, so one job loss can force a sale. And the further out you go, the more exposed you are to the next downturn, because buyers in a falling market retreat to the inner and middle rings first.
If you are looking at one of these 151 suburbs now, pressure-test it:
- What is local employment like? If most residents commute more than 45 minutes, the suburb is vulnerable to fuel prices, toll increases and any shift back to office-based work.
- What is the tenure split? If most households are mortgaged and bought in the past three years, defaults and forced sales will rise faster in a downturn.
- What infrastructure is funded, not just promised? A train line on a 2035 masterplan is not the same as a station opening next year.
- What is the rental yield? If it is below 3.5%, you are betting on capital growth, not cashflow.
The suburbs that will stay above $1 million are the ones that pass those four tests. The others are candidates for mean reversion.
Start here
If you own in one of these 151 suburbs, do not assume the median will keep rising. Run the numbers on what happens if it falls 5 to 10% and you need to sell in the next two years. If that breaks your plan, consider whether you have enough equity buffer or cashflow to ride it out.
If you are buying, treat these new million-dollar medians with scepticism. Ask whether the price reflects structural demand or simply the fact that everything rose together. The suburbs with the best long-term prospects are the ones where the median crossed $1 million because of genuine scarcity (land supply constrained, population growing, infrastructure funded), not because the national median pulled them up by the collar.
Subscribe to the Australian Property Review newsletter for weekly analysis on which markets are holding and which are starting to crack.
General info, not financial advice.