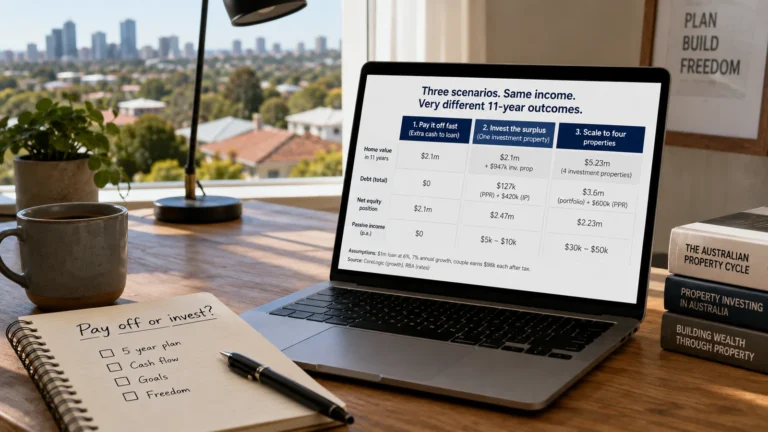
Around seven in ten Australian housing investors own exactly one property, according to Reserve Bank data from 2022–23. That concentration raises a practical question: are most people stopping by choice, or because the path to property two was never mapped?
The deposit for the first investment property is a known quantity. Save 20 per cent, add stamp duty and costs, secure pre-approval, buy. The second purchase looks identical on paper but operates under different constraints. Equity might exist. Income might be steady. Yet the loan doesn’t come through, or comes through smaller than expected, because the investor’s debt serviceability ceiling has moved.
That ceiling, how much total debt a lender will allow based on income, existing commitments and assessment buffers, is now the binding constraint for most portfolio builders. It tightened further under APRA’s debt-to-income framework introduced February 2026, which caps the share of new mortgages written at six times income or above to 20 per cent of a lender’s book. The rule doesn’t ban high-DTI lending outright, but it rations access.
Why the first property feels straightforward
The first investment property is a single-variable problem. Can the buyer service one loan, on top of owner-occupied debt or rent, at the lender’s assessment rate? If yes, and the deposit clears, the deal proceeds.
Property two introduces a system problem. The investor now holds two or more loans. Rental income from property one helps serviceability, but lenders typically shade that income, applying a 20 per cent discount for vacancy and expenses, sometimes more. Interest on the first loan counts as an outgoing. So does any owner-occupied mortgage. The investor’s gross income hasn’t changed, but the lender’s net income figure has shrunk.
Meanwhile, interest rates on outstanding investment loans averaged 6.44 per cent in July 2026, per RBA data, and new loans sat at 6.41 per cent. Assessment rates, used by lenders to stress-test repayment capacity, sit higher again, typically 3 percentage points above the actual rate. An investor borrowing today is being assessed as though rates were near 9.5 per cent.
Under that arithmetic, two properties serviced separately can push total assessed repayments beyond what one borrower’s income will cover, even when actual monthly cashflow is manageable.
The timing trap
Most investors assume equity from property one automatically funds property two. The assumption holds only if three conditions align: the property has appreciated, the lender values it at or near market, and the investor can service the higher total debt load after drawing down that equity.
Miss any one and the plan stalls. Property one might have grown 15 per cent in two years, creating $120,000 in nominal equity. But if the investor’s borrowing capacity hasn’t kept pace, due to flat income, higher interest rates, or new APRA constraints, that equity remains locked.
This is the gap between paper wealth and transactional capacity. Equity is an input, not an outcome. It funds a deposit only when borrowing capacity permits the loan.
The catch
- Usable equity: $120,000 gain sounds large, but lenders typically lend to 80 per cent LVR without mortgage insurance. After deducting existing debt, available equity may be half the headline figure.
- Rental income shading: A property returning $35,000 annual rent is treated as $28,000 or less for serviceability. That $7,000 shortfall compounds across multiple properties.
- Rate assessment buffer: Lenders assess at 9+ per cent even when the actual rate is 6.4 per cent, meaning every dollar of new debt reduces borrowing capacity by more than its real cost.
Where yield and growth pull in opposite directions
The standard property advice splits assets into growth plays and yield plays, as though an investor can cleanly choose one or the other. In a portfolio context, the choice isn’t binary, it’s sequential.
A high-growth, low-yield property might deliver strong equity gains but deplete cash reserves and borrowing capacity along the way. An investor buying purely for growth in year one may find they lack the serviceability to buy again in year three, because the portfolio bleeds cash and income hasn’t risen enough to cover assessed debt.
Conversely, chasing yield alone can leave an investor with properties that cover their costs but grow slowly, limiting the equity available for future purchases. The portfolio stays cash-neutral but capital-constrained.
The practical answer is a blend calibrated to the investor’s income, timeline and risk appetite. A second property that delivers modest positive cash flow, even $50 to $100 per week after all costs, preserves more borrowing capacity than one requiring a $200 weekly top-up, all else equal. That preserved capacity becomes the difference between buying property three in two years versus five.
Steps for the second-property decision
- Model total debt, not property-by-property: Add up all loans, investment and owner-occupied, and calculate total assessed repayments at the lender’s buffer rate. Compare that to net income after the rental shading. The gap is your remaining serviceability.
- Stress-test the portfolio at higher rates: If assessment rates rise another percentage point, does the structure still work? What if one property sits vacant for eight weeks?
- Calculate cash drag per property: For each investment, subtract rent (post-shading), interest, rates, insurance, management fees, maintenance buffer. The result is the true annual cost. Multiply by the number of properties planned. Can your income and savings cover that?
- Review debt structure before buying: Interest-only loans preserve cash flow in the short term but don’t reduce principal. Principal-and-interest loans build equity but increase monthly repayments, reducing serviceability. The right structure depends on whether the next purchase is two years away or five.
- Identify the bottleneck before committing: Is the constraint equity, cash flow or borrowing capacity? Buying a property that solves for equity but worsens cash flow may close the door to property three.
Scenarios: same deposit, different outcome
Consider two investors, each with $150,000 usable equity and $120,000 household income.
Investor A buys a $750,000 apartment returning 4.2 per cent gross yield ($31,500 annually). After interest at 6.4 per cent on a $600,000 loan ($38,400), plus $8,000 in rates, insurance, management and maintenance, the property costs $14,900 per year to hold. Assessed at 9.5 per cent, repayments sit at $57,000. Shaded rental income: $25,200. Net serviceability hit: $31,800.
Investor B buys a $650,000 townhouse returning 5 per cent gross yield ($32,500). Loan of $520,000 costs $33,280 in interest, plus $7,500 other costs, total $8,280 annual shortfall. Assessed repayments: $49,400. Shaded rent: $26,000. Net serviceability hit: $23,400.
Both investors spent the same equity. Investor B preserved $8,400 more annual borrowing capacity, enough, at typical servicing ratios, to support roughly $80,000 additional debt on the next purchase. Over two properties, that difference compounds.
The point is not that townhouses beat apartments, or that yield always wins. It’s that the second purchase’s structure determines whether a third is possible, and investors rarely model that link before they buy.
What happens next
New investor dwelling commitments dropped 8.6 per cent by volume in the June quarter, though they remained 2.8 per cent higher than a year earlier. The market hasn’t frozen, it’s repricing risk and tightening access at the margin. Investors with strong serviceability and diversified income are still borrowing. Those relying on stretched DTI ratios or assuming rental income at 100 per cent are hitting limits earlier.
The next six months will clarify whether the RBA’s hold on rates through mid-2026 turns into cuts or another pause. If cuts arrive, serviceability constraints ease slightly, lenders assess at a margin above the policy rate, so even a 25-basis-point reduction flows through. If rates hold or edge higher, the serviceability ceiling stays where it is, and more investors find themselves one property short of where they planned to be.
Borrowing capacity ceiling hits investors harder than rates covers the mechanics of how lenders calculate serviceability under current settings. Non-bank lending diversification: where mortgage capital is moving tracks where investors priced out by major banks are finding credit, and at what cost.
Start here: before shopping for property two, run the numbers on property three. If the purchase you’re weighing today makes the next one structurally harder, you’re buying an asset, not building a strategy.
Subscribe to the Australian Property Review newsletter for weekly analysis on what’s shifting in credit, yields and portfolio planning.
General info, not financial advice.