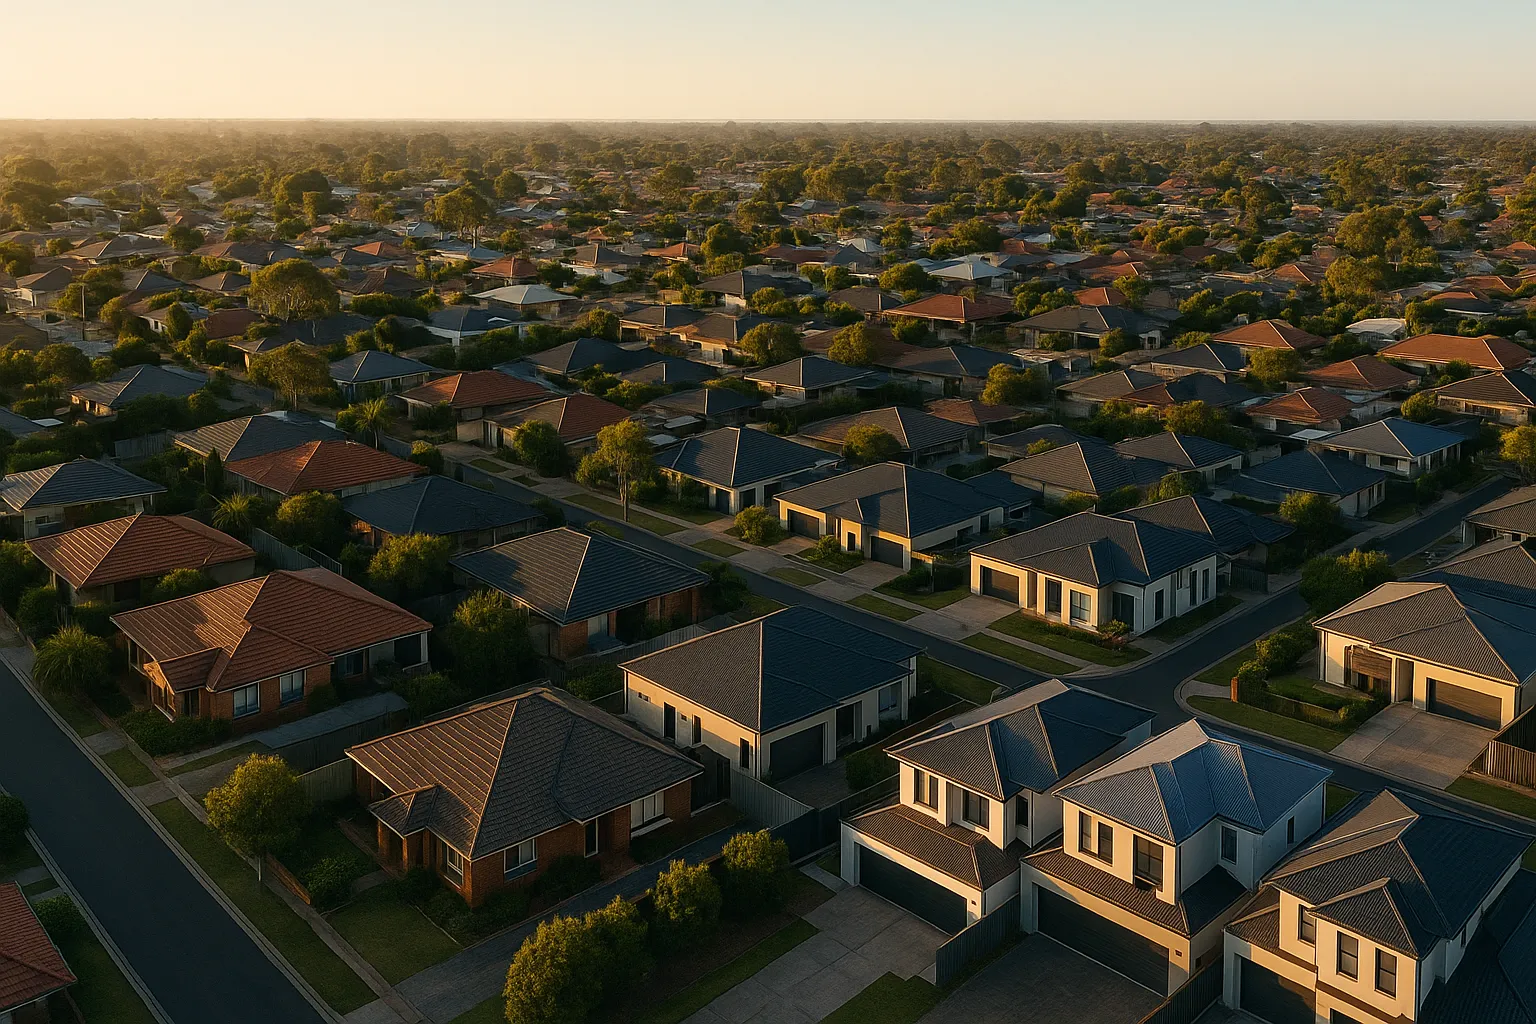
South Australia claimed six of the nation’s ten strongest-performing local government areas in June 2026, according to Hotspotting’s latest Price Predictor Index. Greater Adelaide and regional SA districts outscored every other mainland jurisdiction on measures including inventory levels, days on market, and sold-above-asking activity, even as the broader national market cooled under rate rises and budget uncertainty.
Onkaparinga topped the national ranking with a score of 77 out of 100, followed by Mitcham at 76 and Marion at 73. Tea Tree Gully, Campbelltown and Port Adelaide Enfield all scored 70 or above. Only Palmerston in the NT, Bayswater in WA, and two Tasmanian LGAs broke SA’s dominance of the top ten.
The supply mechanics
Greater Adelaide runs the tightest inventory conditions of any Australian capital. When listings clear quickly, the compounding effect is visible: days on market collapse, properties sell above asking price, and rental vacancy rates fall below functional replacement levels. Regional SA districts including The Barossa, Clare Valley and Riverland showed similar patterns, with durable rather than speculative demand.
The strength is real, but the driver, constrained supply meeting sustained interstate migration, creates fragility if either variable shifts. Markets that rely on chronic undersupply to sustain price momentum lack the buffer to absorb even modest demand softening without sharp repricing.
What changed nationally and what didn’t
Three RBA rate rises between March and June 2026, combined with Federal Budget changes targeting investor tax settings, hit sentiment across most capital cities. Sydney and Melbourne both saw rising days on market and weakening clearance rates. PropTrack data confirmed Adelaide’s median house price fell for the second consecutive month, breaking a multi-year uptrend.
Yet the LGA-level index still shows SA outperforming every mainland state, suggesting the pullback is shallow relative to the east coast. The divergence reflects timing more than immunity: Adelaide entered the tightening cycle later, rose faster, and now faces the same macroeconomic headwinds with less pricing cushion already built in.
Second-order effects
Investor composition matters. Adelaide attracted strong interstate landlord interest during 2024–2025, chasing higher yields than Sydney or Melbourne offered. Announced budget changes reducing depreciation incentives and tightening negative gearing appear to have slowed new landlord entrants, which PropTrack economists flagged as a likely contributor to Adelaide’s recent price softening.
If investor demand was a material driver of the upswing, its withdrawal won’t be neutral. Thinly-traded markets amplify moves in both directions: the same supply tightness that pushed prices up quickly can accelerate falls when buyers step back, because there’s little volume cushion to stabilise transaction pace.
Key numbers
- Onkaparinga scored 77/100, the nation’s highest LGA ranking in June 2026
- Six of the top ten LGAs were in South Australia
- Adelaide median house prices fell for two consecutive months through June
- Three RBA rate rises landed between March and June 2026
- Regional SA outperformed every other mainland regional jurisdiction
Base case and downside scenarios
Base case: Adelaide cools but stabilises above pre-2024 levels, supported by interstate migration inflows and lingering supply constraints. Days on market rise modestly, clearance rates normalise, but no sharp repricing.
Downside: if the RBA holds rates elevated into 2027 and investor activity contracts further, Adelaide’s thin inventory flips from strength to weakness. Markets that rose on scarcity can fall on illiquidity, fewer transactions mean wider bid-ask spreads, longer marketing periods, and vendors chasing price down to clear stock. Regional SA, less liquid than Greater Adelaide, would see that dynamic play out faster.
Wild card: fiscal intervention. If the SA government responds with demand-side stimulus (grants, stamp duty concessions) to offset federal tax changes, it could extend the cycle artificially, storing pressure for a larger correction later.
Red flags for the next quarter
Watch inventory growth in Onkaparinga, Mitcham and Marion specifically. If listings rise 15–20% quarter-on-quarter without matching buyer activity, the supply tightness thesis unwinds quickly. Monitor auction clearance rates: Adelaide’s published clearance data can be noisy, but a sustained move below 60% would confirm the shift from seller’s to buyer’s market is underway.
Track rental vacancy separately. If vacancy edges above 2%, landlords lose pricing power, which feeds back into weaker investor appetite and further stock additions. The cycle tightens in reverse.
Bottom line
South Australia’s dominance of the top-performing LGA list reflects real supply constraints and strong recent demand, but the same mechanics that drove outperformance create asymmetric downside risk. Markets that rise on scarcity fall on illiquidity. If you’re buying in Greater Adelaide now, stress-test serviceability at current rates plus 100 basis points, and assume days on market double from here, if the deal still works, proceed. If you’re selling and can move before spring, do.
For a clearer picture of how landlord exits are reshaping supply in other capitals, see Rental stock exits: when landlords sell, tenants pay the price. If you’re comparing yields post-tax reform, Brisbane rental yield: where investors are buying after tax reform covers the mechanics.
Subscribe to the newsletter for weekly signal on what’s shifting and where.
General info, not financial advice.