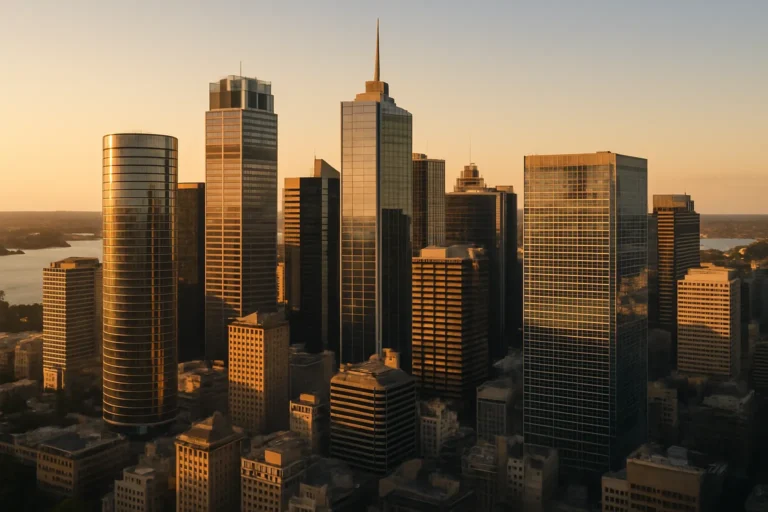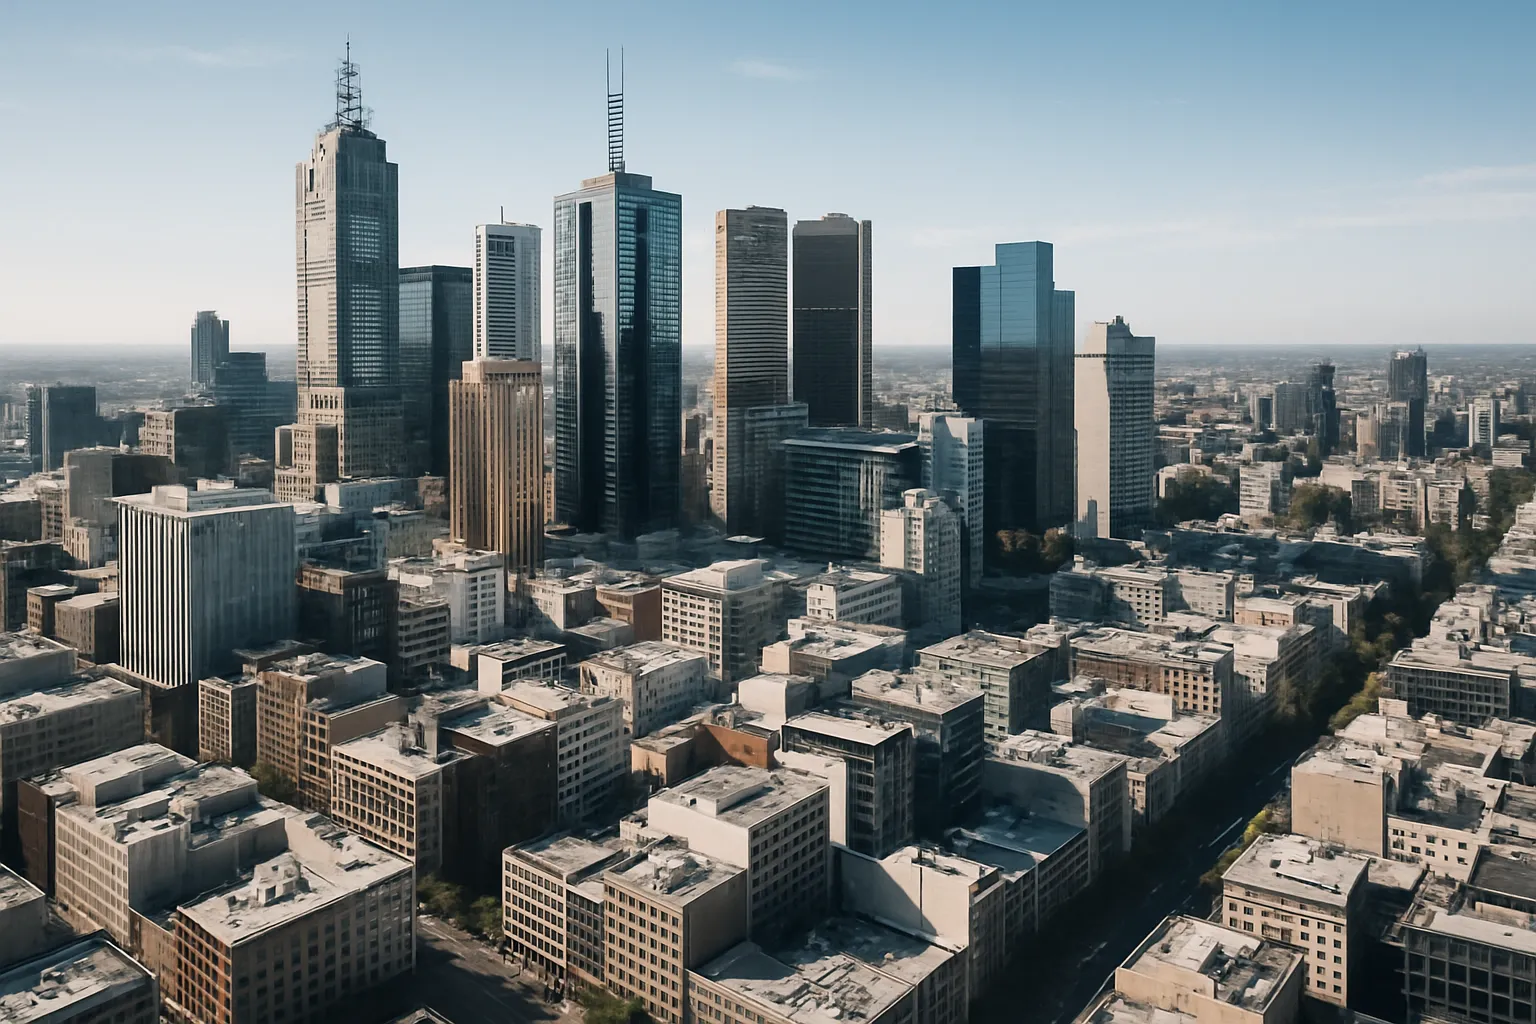
GPT’s recent commentary on Melbourne’s CBD recovery has flagged what the Property Council’s occupancy data has been showing for months: Melbourne is not tracking Sydney’s pace. The gap is structural, not seasonal.
Sydney’s CBD office occupancy has been climbing steadily since mid-2023, now sitting in the mid-70s percentage range on a typical weekday. Melbourne sits closer to the mid-60s. That 10-percentage-point gap translates to thousands of empty desks, lower foot traffic, and weaker demand signals for landlords.
The driver is hybrid work. Melbourne adopted flexible arrangements faster and deeper than Sydney during the pandemic, and those patterns have stuck. Employers in Melbourne are less likely to mandate five days in the office. Workers have built routines around two or three days on-site, and reversing that requires either a major cultural shift or a significant economic shock.
Why Melbourne adopted hybrid work more firmly
Melbourne’s lockdown experience was longer and stricter than Sydney’s. Workers spent more time at home, built home offices, and relocated further from the CBD. By the time offices reopened, the infrastructure for remote work was already embedded.
Sydney’s return-to-office push came earlier and harder. Major employers in finance and professional services set clearer on-site expectations. The city’s public transport network also favours commuting over Melbourne’s sprawl, where longer travel times make hybrid schedules more attractive.
Geography matters too. Melbourne’s suburbs stretch further, with more workers living 40-plus kilometres from the CBD. Sydney’s density is tighter, and the average commute is shorter. That difference shows up in occupancy rates.
What the occupancy gap means for office investors
If you hold or are considering Melbourne CBD office assets, the occupancy gap is the key risk to price-test.
Lower occupancy means slower rental growth, higher vacancy risk when leases roll, and weaker tenant demand for secondary stock. Prime A-grade assets with long-term anchor tenants are holding up. B-grade assets without recent refurbishments are seeing longer void periods and tenant incentives creeping higher.
Yields on Melbourne CBD office assets are sitting 50 to 75 basis points wider than equivalent Sydney stock. That spread reflects the occupancy gap and the uncertainty around when (or if) it closes.
The numbers that matter
- Melbourne CBD occupancy: mid-60s percentage range (Property Council data, typical weekday)
- Sydney CBD occupancy: mid-70s percentage range
- Yield gap: Melbourne CBD office yields are 50-75 basis points wider than Sydney equivalents
- Lease rollover risk: B-grade Melbourne CBD assets are seeing tenant incentives rise as hybrid work patterns hold
Two scenarios for the next twelve months
Base case: Melbourne occupancy lifts slowly, reaching the high-60s by mid-2027. Sydney continues to mid-70s or higher. The gap narrows slightly but doesn’t close. Prime assets hold value, secondary stock sees modest capital pressure.
Downside: A broader economic slowdown accelerates cost-cutting, and more employers formalise permanent hybrid policies. Melbourne occupancy stalls in the mid-60s, and the gap widens. Secondary stock reprices lower, and landlords face longer void periods.
Upside: A wave of return-to-office mandates driven by productivity concerns or generational workforce change. Melbourne occupancy jumps to the low-70s within eighteen months, closing most of the gap. Yield compression follows, and Melbourne CBD assets reprice closer to Sydney levels.
The upside scenario requires a catalyst that hasn’t appeared yet. The base case is more likely.
Trade-offs for investors considering CBD office exposure
If you’re weighing Melbourne CBD office assets, the question is whether the yield premium compensates for the occupancy risk and slower rental growth.
For patient capital with a five-plus-year hold period, prime A-grade assets with strong anchor tenants offer defensible income and potential capital upside if the gap narrows. For shorter-term investors or those needing near-term rental growth to service debt, the occupancy gap is a material headwind.
Secondary stock is harder to justify unless you’re buying at a significant discount and have a clear refurbishment or repositioning plan. The risk is that hybrid work remains entrenched, and demand for older stock stays weak even as the broader market recovers.
One comparison: resilient property markets across Australia showed which regions held through past downturns. CBD office markets don’t feature in that list, and the hybrid work shift is a structural change, not a cyclical dip.
What to watch over the next quarter
Property Council occupancy data releases monthly. Watch for any sustained lift in Melbourne’s numbers, or any widening of the gap.
Lease rollover schedules for major CBD buildings. If anchor tenants renew at lower space requirements, that’s a signal hybrid work is locked in.
Employer policy shifts. Any major Melbourne-based employer announcing a return-to-office mandate would be a leading indicator. So far, those announcements have been rare.
Transport infrastructure. The Melbourne Airport Rail Link and Metro Tunnel projects will shorten commute times for some workers when complete. That could support occupancy recovery, but both projects are years from full operation.
Start here
If you hold Melbourne CBD office exposure, model your downside scenario with occupancy stuck at current levels for another two years. If your cashflow and debt serviceability hold in that scenario, you’re positioned to ride out the gap.
If you’re considering new CBD office investment, compare the yield premium to the occupancy risk and rental growth outlook. Prime assets with long-term anchor tenants are the defensive play. Secondary stock requires a margin of safety you may not be getting at current pricing.
Subscribe to the newsletter for weekly updates on CBD office markets and occupancy trends.
General info, not financial advice.