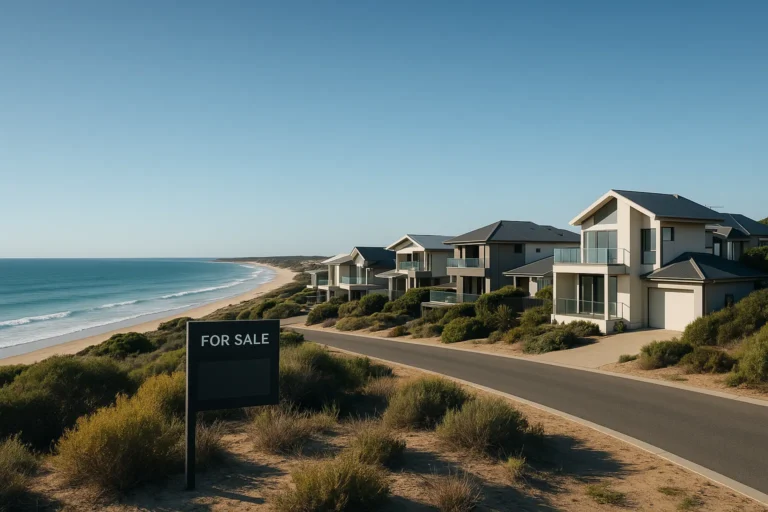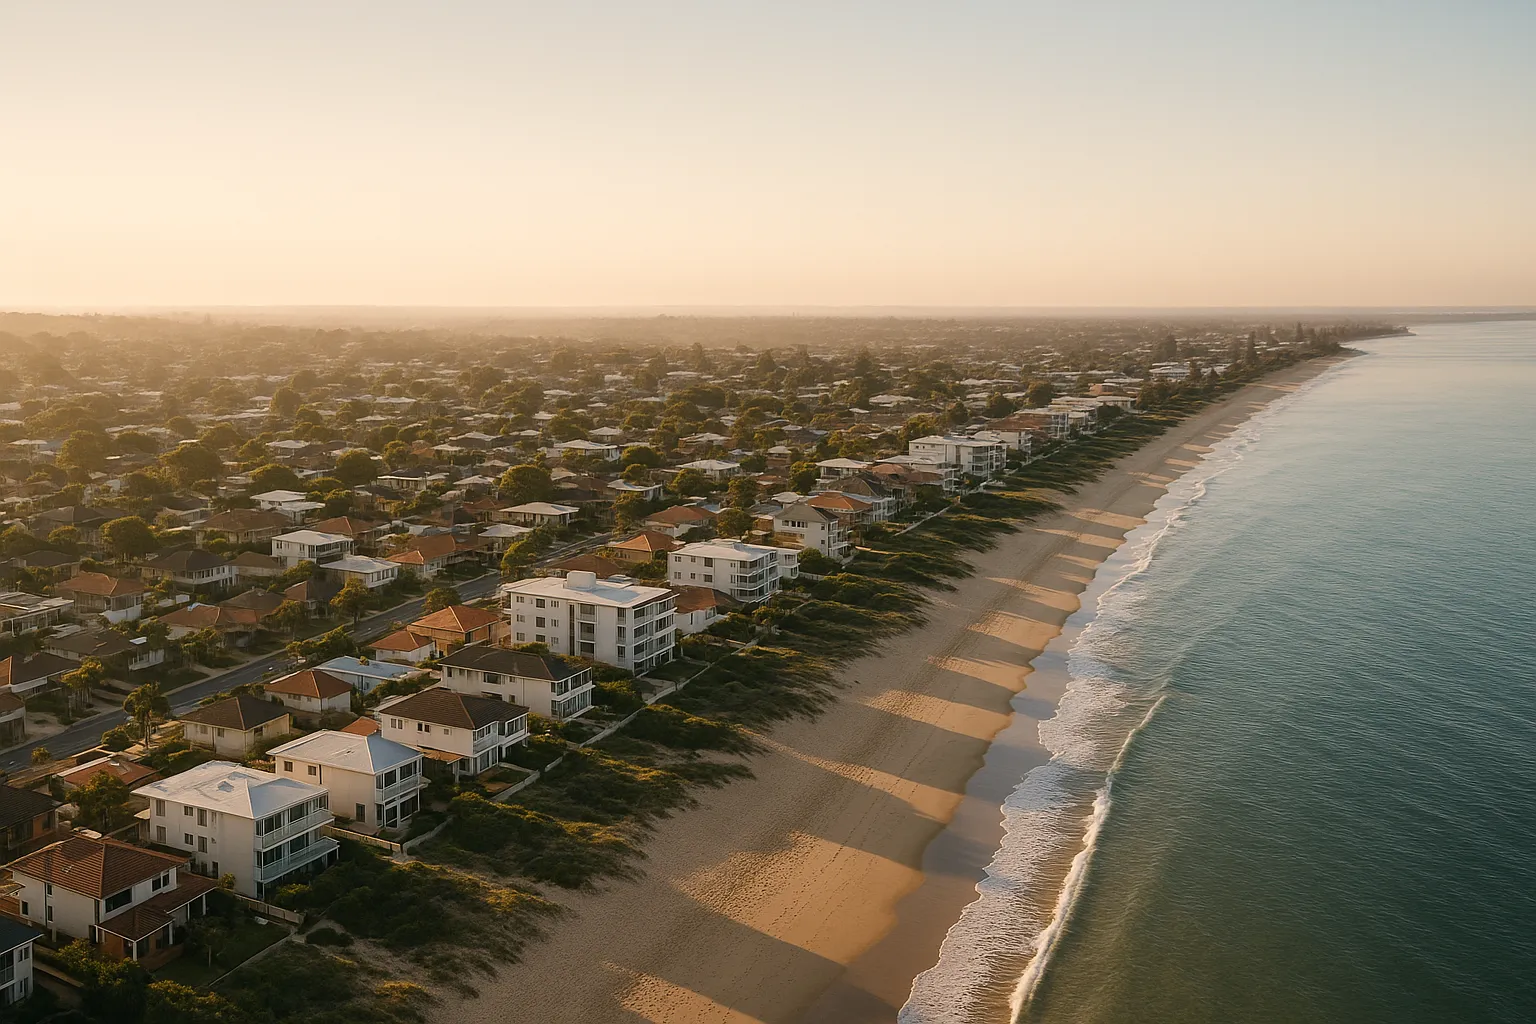
The 2100 headline grabs attention, but the market repricing is happening this decade. Insurers, banks and local councils already have access to the same flood models and coastal erosion maps that underpin those distant projections, and they’re acting on them now, not in 75 years.
Some coastal suburbs are seeing premium increases, coverage exclusions or stricter lending serviceability buffers even when the property sits above today’s king tide line. The risk being priced is probability over time, not an event next Tuesday.
Where the early pressure shows up
Three mechanisms are already tightening, unevenly across the coast:
- Insurance premiums and excesses: properties in mapped flood or storm surge zones see higher annual costs, larger excesses (sometimes $10,000-plus for water damage), or outright exclusions for certain perils. Some owners find their premium has doubled in three years without a claim.
- Lending serviceability: a few lenders apply higher interest rate buffers or cap loan-to-value ratios for properties flagged in council or state hazard overlays, treating climate exposure like other location risks (bushfire, landslip).
- Strata levies and special assessments: beachfront apartment blocks face rising costs for seawall maintenance, sand replenishment contributions, or engineering reports now required by some insurers before renewal.
The effect is uneven. Two suburbs ten kilometres apart can have vastly different insurer and council risk classifications depending on elevation, drainage, past storm history and whether the local government has updated its hazard mapping in the last five years.
The valuation and liquidity knock-on
Higher holding costs erode net rental yield and squeeze borrowing capacity. A coastal townhouse that cleared pre-approval eighteen months ago might now hit serviceability limits for the same buyer at the same income, purely because the insurer quoted $4,500 annually instead of $1,800.
Liquidity tightens when buyer pools shrink. Properties requiring flood cover or subject to council planning overlays lose some interstate or first-home buyers who can’t meet the higher deposit or ongoing cost hurdles. Auction clearance rates in affected pockets can run 10-15 percentage points below the metro average, even in strong markets.
Transaction volumes matter for price discovery. Fewer sales per quarter make it harder to establish a confident valuation, which feeds back into lender caution.
Which areas see it first
No single postcode list captures the pattern, because risk overlays update at different speeds and insurers weight their models differently. But common features include:
- Low-lying coastal flats and estuaries with historical king tide or river flooding
- Beachfront or near-beachfront where councils have published coastal hazard lines or erosion set-backs
- Older strata schemes on piles or slab-on-ground near tidal waterways, especially if the building’s engineering certificate is more than ten years old
- Suburbs where the local council recently rezoned land or introduced planning controls citing sea level rise (public record, often in local environment plans)
The catch: properties well above current flood lines can still be flagged if they sit within a projected 2050 or 2070 hazard envelope that insurers and banks are already using for underwriting.
Key numbers
- Premium increases: some coastal policies up 50-100% over three years in mapped zones
- Excess clauses: water damage excesses now $5,000-$15,000 in high-risk areas, vs $500-$1,000 standard
- Lending buffers: select lenders add 0.25-0.50% serviceability margin for properties in hazard overlays
- Liquidity gap: auction clearance rates 10-15pp lower in affected coastal pockets vs metro average
What could change the timeline
Government intervention (betterment grants, shared-equity buybacks, mandatory disclosure reform) could slow or accelerate the repricing depending on design. A state-backed reinsurance pool for coastal flood, similar to the cyclone pool in northern Australia, would soften premium spikes but might also lock in development patterns that worsen long-term exposure.
Interest rate cuts improve serviceability across the board, but they don’t erase the gap between a $1,800 and a $4,500 insurance bill when the borrower is already at 28% debt-to-income.
Physical mitigation (levees, seawalls, drainage upgrades) can shift a suburb’s risk profile, but funding and approval timelines are multi-year and the benefit shows up in insurer models only after completion.
Practical steps before you buy or refinance
- Request a copy of the council’s flood and coastal hazard maps for any property within two kilometres of tidal water, these are usually public and free.
- Get an insurance quote in writing before you exchange, not after, some buyers discover post-settlement that their broker’s indicative price was half the actual premium.
- Ask the lender explicitly whether the property sits in a risk overlay that attracts a serviceability buffer or LVR cap, not all lenders disclose this upfront.
- For apartments, review the last two years of strata committee minutes for any discussion of insurance renewal difficulties, premium jumps, or engineering works tied to flood or erosion risk.
- Factor the higher holding cost into your yield and cashflow model, a 1.5% gross yield after a $3,000 annual insurance increase might not cover your serviceability cushion.
If you’re holding coastal property and see your premium or strata levy climbing, compare quotes annually and check whether physical mitigation (better drainage, raised electrical, flood barriers) qualifies for an insurer discount. Some do, many don’t, ask in writing.
Subscribe to the weekly Australian Property Review newsletter for the next round of insurance and lending data as councils publish updated hazard maps.
General info, not financial advice.