Australia now ranks 15th globally for entrenched long-term renting, with property prices climbing 22% faster than household incomes since 2015. That puts the country sixth-worst among 31 nations tracked for price-to-income deterioration, behind only Portugal, Canada, the US, Netherlands and Switzerland.
The price-to-income index hit 121 from a 2015 baseline of 100. Translation: a deposit that matched incomes ten years ago now falls short by more than a fifth in real terms. Homeownership sits at 62.7%, while 31.7% of households rent. Trans-Tasman neighbour New Zealand fares worse, ranked 10th with a 57.5% ownership rate and 40% of households renting.
Recent price falls of 5-7% in Sydney and Melbourne have done little to narrow the structural gap. A 7% correction on a $1.2 million median brings the price to $1.116 million. Median household income around $116,000 means a 20% deposit still requires $223,200, or 1.9 years of gross household income saved at 100% (impossible) or 9.5 years at a 20% savings rate (before tax, before living costs). The arithmetic hasn’t shifted materially.
Where the entry threshold sits now
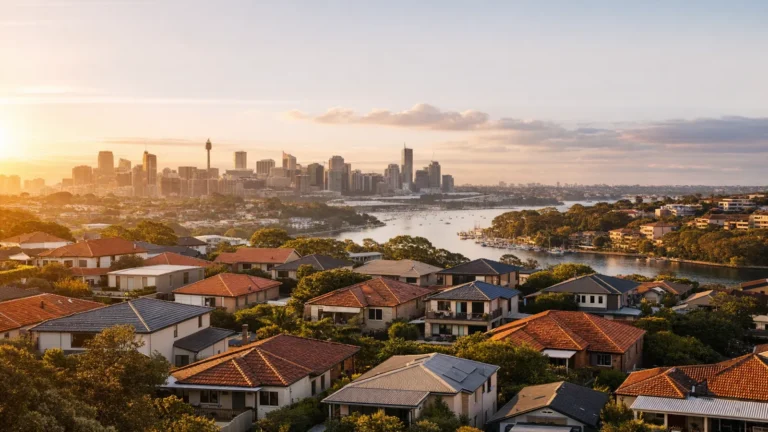
Sydney median prices around $1.1 million post-correction require household income north of $200,000 to clear serviceability at current rates, assuming minimal other debt. Households earning $120,000-$150,000 remain locked out of standalone houses entirely. Melbourne’s $900,000 median drops the income floor to roughly $165,000 for houses, with units offering marginal access around $130,000.
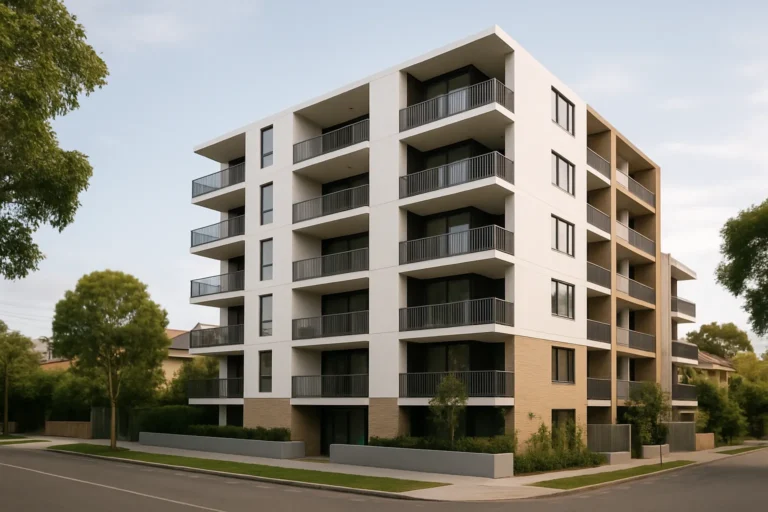
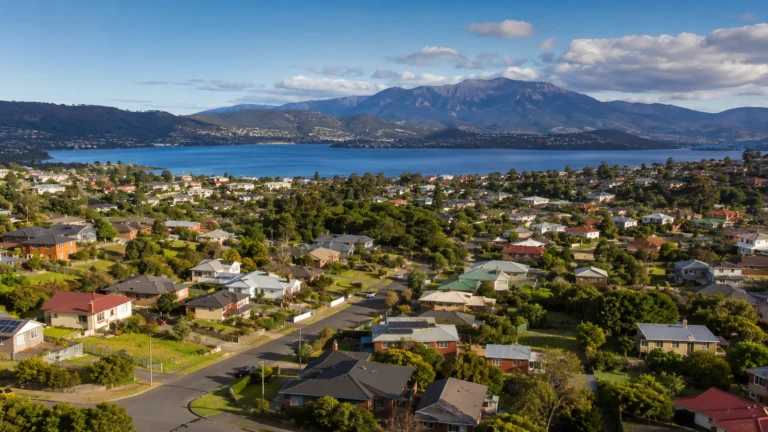
Brisbane ($850,000), Adelaide ($780,000) and Perth ($750,000) bring the serviceability threshold down to $155,000, $145,000 and $140,000 respectively. Canberra ($950,000) sits between Melbourne and Brisbane. Hobart ($700,000) and Darwin ($550,000) theoretically open access at $130,000 and $105,000, but thin job markets limit who can relocate.
First-home buyers with parental guarantees or gifted deposits bypass the savings time frame but still hit serviceability walls. A household earning $100,000 clears roughly $650,000-$700,000 in borrowing capacity at 3% buffer rates, locking them into units in most capitals or requiring a move to regional centres.
The pressure on renters
Median rent as a share of disposable income sits at 23.1%, but that average masks the spread. Households in the bottom income quartile spend closer to 35-40% on rent in Sydney and Melbourne, while those earning above $150,000 typically allocate under 20%.
About 6.5% of Australian households now spend over 40% of income on housing, a threshold economists flag as severe stress. That’s lower than Denmark (22.7%) or Luxembourg (20.1%), but the direction matters more than the snapshot. The share has climbed from 5.1% in 2015, and wage growth has trailed rent growth in every capital except Perth over the past three years.
Key numbers
- House prices grew 22% faster than incomes since 2015
- Homeownership rate: 62.7%, down from 67% in 2016
- Renters spending over 40% of income on housing: 6.5%, up from 5.1%
- Sydney median requires ~$200k household income to clear serviceability
- Recent 5-7% price falls reduce a $1.2m median to $1.116m (deposit still $223k)
What could narrow the gap
Three levers move the dial: faster income growth, lower interest rates, or sustained price falls. Wage growth running at 4% while prices stay flat for three years closes roughly 12% of the gap. Rate cuts of 100 basis points lift borrowing capacity by around 8-10%, enough to bring $700,000 buyers into the $750,000-$770,000 range but insufficient to bridge the gap for sub-$100,000 earners.
Sustained price falls of 15-20% would reset affordability materially, but that requires either a credit event or a supply surge large enough to overwhelm demand. Neither looks probable in the next 12-18 months. Prestige property market repricing in Sydney suggests some vendor capitulation at the top end, but sub-$1.5 million stock remains tight.
Policy proposals circulating include longer default lease terms (two years instead of one) and a target of 10% public housing in new developments. Longer leases reduce churn costs for renters but don’t address the income-price gap. Public housing supply takes five to seven years to deliver at scale, and even a 10% target in new builds adds only 2,000-3,000 units annually against a national shortfall estimated at 100,000-plus.
The trade-off no one wants to name
Closing the affordability gap without crashing prices or triggering a recession requires either a decade of flat nominal prices while incomes catch up, or policy intervention that redirects capital away from housing (higher land taxes, tighter negative gearing, zoning reform that floods supply). The first path locks existing owners into stagnant equity for years. The second path faces entrenched political resistance.
Renters in the $80,000-$120,000 household income band face the hardest squeeze. Too high to qualify for public housing, too low to service a mortgage in any capital city without extreme leverage or parental help. Units in outer suburbs offer the only marginal entry point, and even that requires perfect credit, minimal other debt, and a willingness to stretch serviceability limits.
Higher earners ($150,000-plus households) retain access but face longer deposit accumulation periods and higher interest rate risk. A borrower at 90% LVR on a $900,000 property ($810,000 loan) pays roughly $5,400 monthly at 6.5%. A 1% rate rise adds $675 per month, or $8,100 annually, enough to tip a household from comfortable to stretched if wage growth stalls.
Scenarios that shift the picture
Base case: prices drift sideways for 18-24 months, wage growth at 3-4% closes 6-8% of the gap, serviceability eases slightly if rates drop 50-75 basis points by late 2025. Entry thresholds fall by $20,000-$30,000 in household income terms. Not enough to open access for sub-$100,000 earners, marginal improvement for $120,000-$140,000 cohort.
Upside (for buyers): recession or credit tightening drives prices down 15-20%, unemployment stays below 5%, rates drop 150 basis points. Entry thresholds fall by $40,000-$50,000 in income terms. Melbourne and Brisbane households earning $120,000-$130,000 re-enter the market for units, outer-ring houses become accessible to $150,000 earners.
Downside (for renters): migration stays elevated, supply lags, prices resume 3-5% annual growth while wage growth stays at 3%. Gap widens another 6-9% over three years. $130,000 households currently marginal get locked out, $150,000 households face unit-only options in Sydney/Melbourne.
What to do if you’re priced out now
Pressure-test your serviceability ceiling with a broker using current rates plus a 3% buffer. If you’re $50,000+ short of the income required for your target property type and location, waiting for small price falls won’t close the gap. Consider: regional relocation if work allows, unit entry in a capital city as a stepping stone, or shared equity schemes (limited availability, income caps apply).
If you’re renting and not saving toward a deposit, focus on lease stability and rent affordability rather than homeownership timing. Push for longer lease terms where possible. Track your rent-to-income ratio; if it exceeds 30%, you’re in stress territory and should prioritise either income growth (reskill, job switch) or a move to cheaper accommodation before the gap widens further.
Subscribe to the newsletter for monthly affordability updates, serviceability threshold tracking by city, and policy changes that shift entry points.
General info, not financial advice.