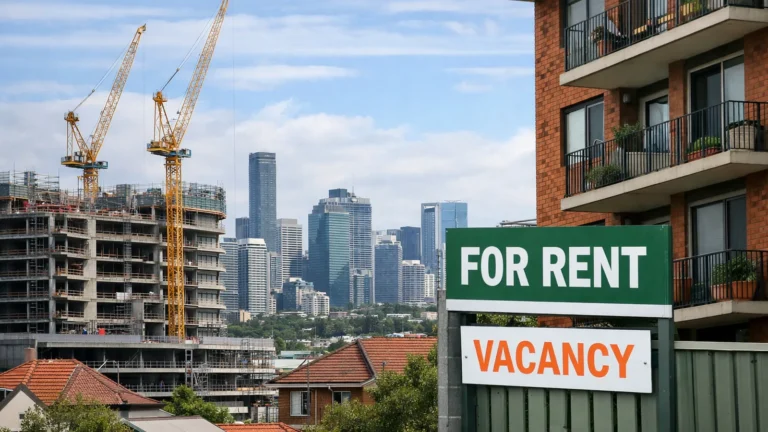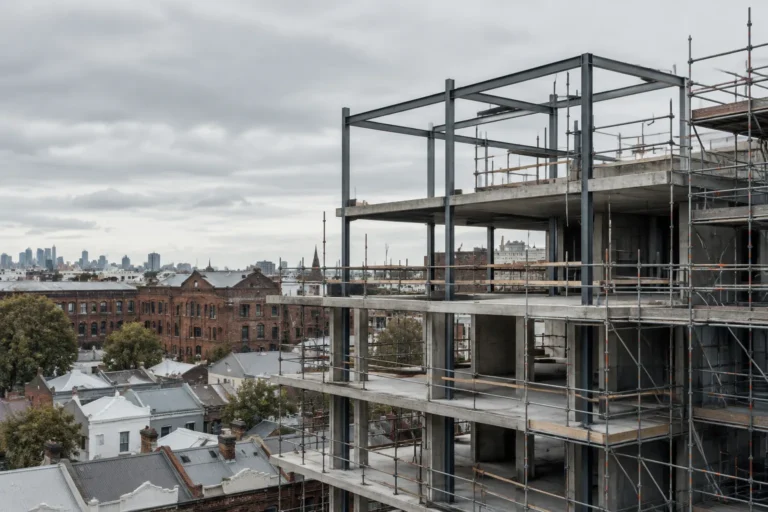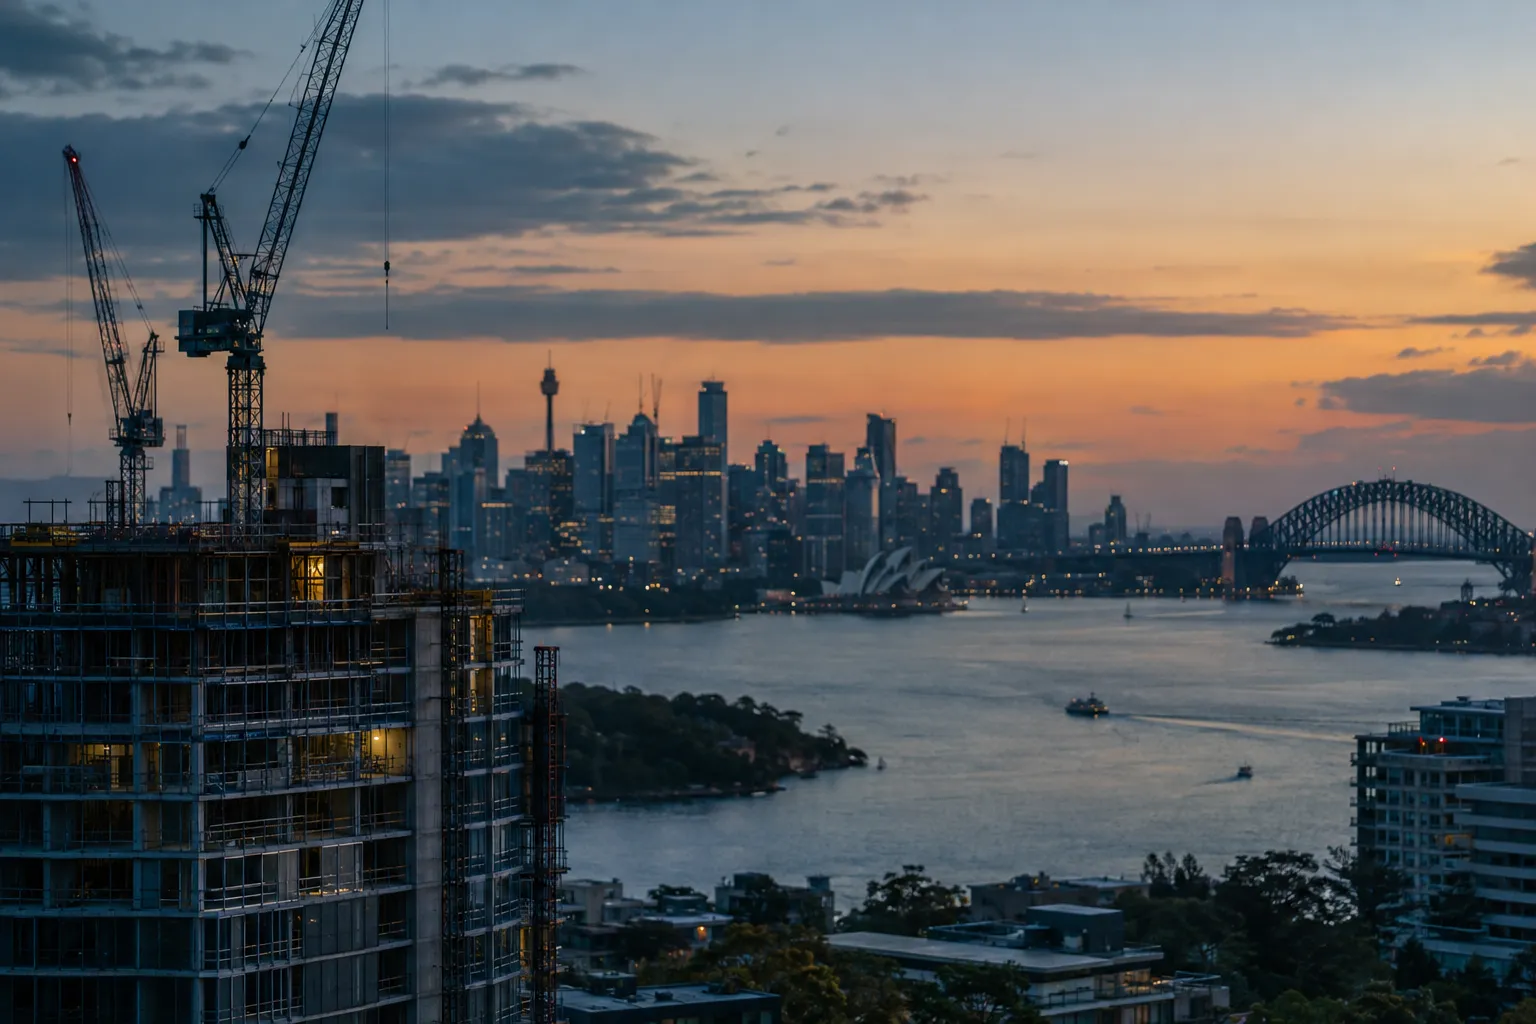
A new NSW borrower buying a median-priced home now needs 30.7% of average household earnings just to service the loan. That is the highest reading in 32 years of data, according to an internal NSW Treasury assessment. The number is striking on its own. The more important detail sits underneath it: Treasury thinks the state’s building activity is more rate-sensitive than anywhere else in the country.
The NSW mortgage burden in numbers
The 30.7% figure is a flow measure. It describes what a new borrower faces today, not what existing owners are paying. That matters because most of the pain lands on people trying to get in, and on the developers and builders who depend on them.
Here is what the Treasury work points to:
- Servicing a loan on a typical NSW home takes 30.7% of average household income, the worst in the 32-year series.
- A 1 percentage point rate rise held for three years would cut NSW dwelling investment by 3%.
- Treasury expects about half that hit, roughly 1.5%, in the rest of Australia.
- Sydney’s median house price has slipped roughly 8% since December to $1.66 million.
- That is still $509,000, or 44%, above Brisbane’s $1.15 million.
The price fall has not fixed affordability. A house that is 8% cheaper but still costs 44% more than the next-nearest big market keeps the income hurdle high, and rates do the rest.
Key numbers
- 30.7% of average household income to service a median-priced NSW home
- 3% fall in NSW dwelling investment from a 1 point rate rise held three years
- $1.66 million Sydney median house price, down about 8% since December
- $5.3 billion removed from stamp duty estimates in June
Why dwelling investment reacts harder in the dearest market
High prices mean high loan sizes. High loan sizes mean each rate move changes the repayment by a larger dollar amount. In a market where borrowers are already stretched to a record share of income, there is less room to absorb another rise.
That feeds back into supply through a simple chain. Buyers with less borrowing capacity bid less. Developers see weaker presales and softer sale prices. Projects that only just stack up on paper stop stacking up. Finance gets harder to secure, and sites sit idle.
Treasury’s modelling captures that chain in one figure. The reported hit to housing starts is 2.5% in NSW, against 1% nationally. Two and a half times the national effect is not a rounding error. It says the state’s pipeline is carrying more rate risk than its share of national construction would suggest.
We covered the builder side of this squeeze in our look at interest rate rises builders can’t absorb. The NSW data adds a state-level layer to that story.
The part headline mortgage-stress coverage misses
Most coverage of a record mortgage burden asks one question: can households cope? That is a fair question, but it is only half the story. The other half is what stretched affordability does to new housing.
If buyers pull back and builders pause, fewer homes complete. Fewer completions keep supply tight. Tight supply props up prices and rents later on. So a rate-driven slowdown can ease pressure on borrowers today and sharpen the shortage tomorrow.
That is the tension for any national completion target. The state with the biggest gap between housing need and housing delivered is also the state where building is most sensitive to the cost of money. A target set without allowing for that is a target that rate rises can quietly erode.
There is a limit to what this reading proves. The Treasury figures are modelled estimates built on assumptions about how long rates stay higher. They are scenarios, not forecasts, and real outcomes will depend on wages, migration, construction costs and lender behaviour.
The budget is exposed too
The housing slowdown also reaches the state’s finances. Growth projections were cut to 1% for two years, and $5.3 billion was removed from stamp duty estimates in June. A further downgrade is expected next month, which could widen the $2.3 billion deficit forecast for 2026-27.
The politics are already visible. The premier warned of permanent job and business losses if conditions harden. The treasurer pointed to inflation control and an $11 billion debt-reduction plan. Those two messages pull in different directions: one worries about the damage from high rates, the other stresses that bringing inflation down is the priority.
Stamp duty is the link between the two. When fewer homes change hands at lower prices, revenue falls. That gives the government a direct stake in the housing market’s health at the same time as it argues the case for tight policy.
What to watch from here
Three signals will show whether the Treasury scenario is playing out:
- Approvals and starts in NSW over the next two or three quarters, compared with other states.
- Developer finance conditions, including presale requirements and lender appetite for apartment projects.
- The next NSW budget update, where a stamp duty downgrade would confirm that transactions are weakening.
For readers, the practical step is to test your own numbers against a higher-rate scenario. Our guide to the RBA, interest rates and repayments explains how to work out what an extra percentage point means for your repayment. If you are borrowing near your limit, build in a buffer before you commit. Our piece on how mortgage buffers are thinning covers where that cushion comes from.
If you want the weekly signal on rates and housing, subscribe to the Australian Property Review newsletter.
General info, not financial advice.