Property prices by suburb rarely move in step, yet most coverage of a falling market leans on a single city-wide number. That number is an average of very different places. It tells you little about what one particular home is worth.
Take a hypothetical $1,000,000 house. A reported 5 per cent fall feels like a $50,000 loss, and that is how it lands emotionally. But most Australian markets enjoyed substantial gains in the years before the dip. Owners also tend to hold for roughly 10 years, which is longer than one cycle. Over that span, sale prices have generally come in above purchase prices.
One city, many markets
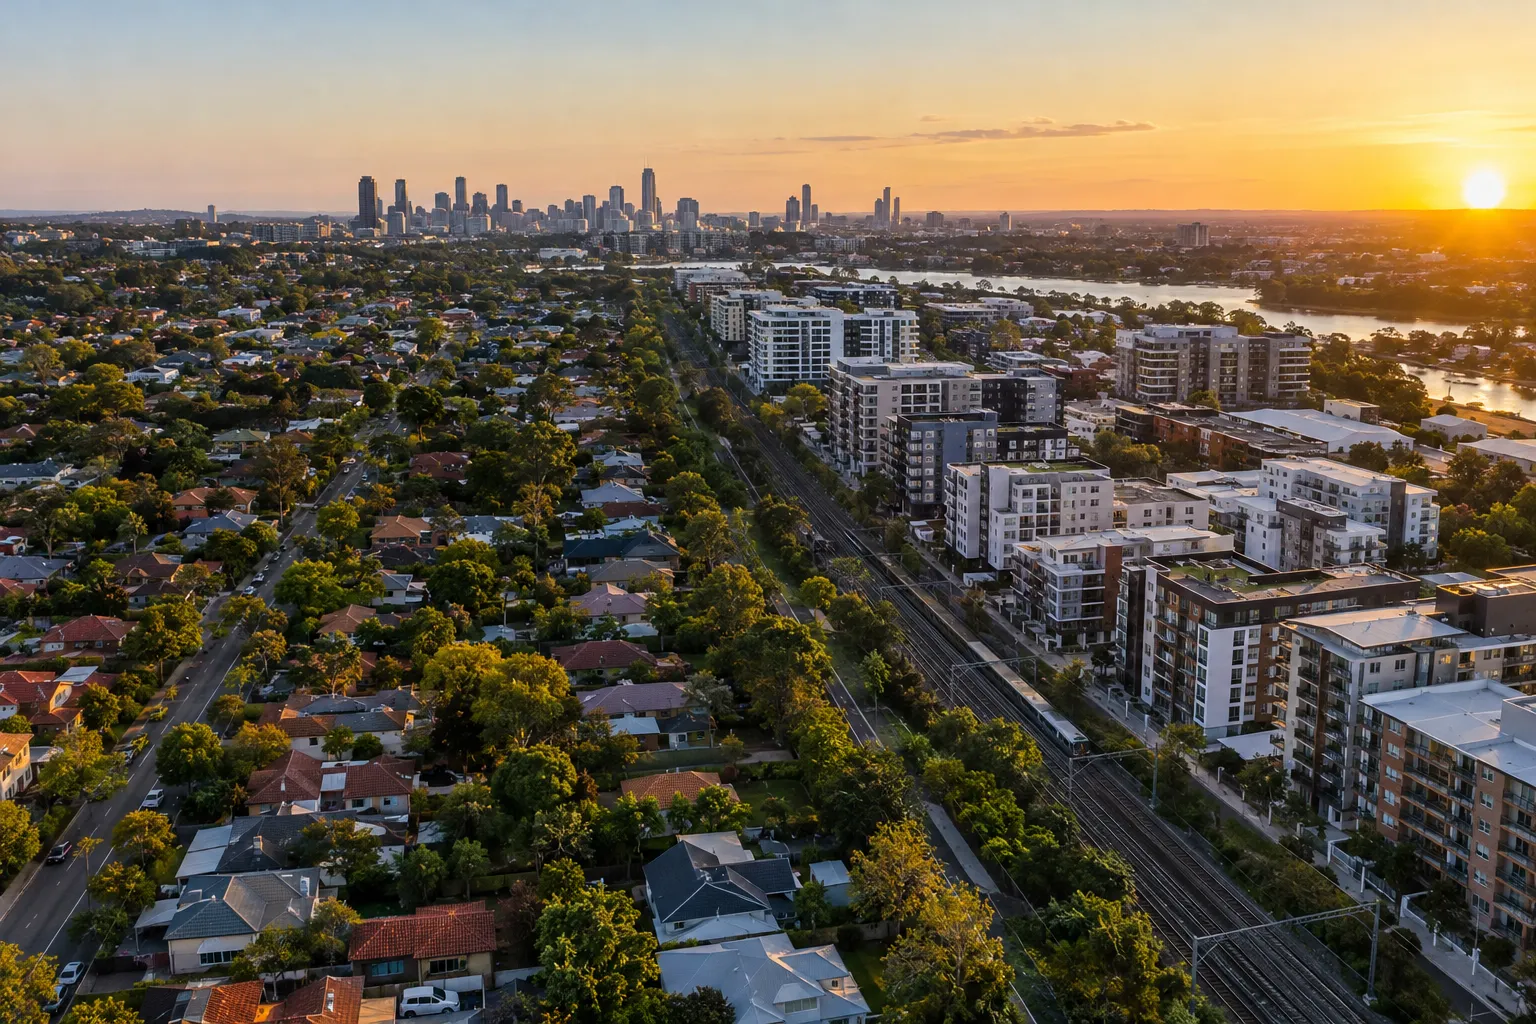
Five-year price charts broken down by Local Government Area, with houses and apartments split out, show how wide the spread can be. The gap appears between cities, and it also appears inside them. A city median blends a leafy house-heavy suburb, an apartment corridor and an outer growth area into one figure. In a falling market that blend can hide pockets that held up and pockets that slid.
So the headline figure answers a question almost nobody is actually asking. Buyers and sellers deal in one suburb, one street and one dwelling type.
Why interest rates do not explain the gaps
The cash rate is the same for every borrower in the country. If rates alone drove prices, every suburb would move together. They do not, which points to local forces.
Demand clusters around suburbs with good amenity and around transit corridors. New infrastructure can shift that demand quickly, lifting some areas while others stay flat. That is the demand side of the story.
Supply is the other half
Where land is scarce, competing buyers bid prices up. Where building is easier, new stock arrives and growth tends to be steadier.
Dwelling type matters here too. Established areas mostly add medium-to-high density stock, because that is what planning and site sizes allow. New detached houses are hard to create in those same areas. So houses and apartments follow separate supply paths, even inside one suburb. A flat and a house a few streets apart can post quite different five-year results.
Key numbers
- 5 per cent: the fall in the illustrative example, equal to $50,000 on a $1,000,000 home
- Roughly 10 years: the typical ownership period, longer than a single price cycle
- 5 years: the window used in the Local Government Area comparisons
The catch: monetary policy is a blunt tool
Tighter policy slows growth and looser policy can revive it. But the effect is uneven, because it passes through those local supply and demand conditions. A rate move helps or hurts a scarce-land, high-amenity suburb differently from an easy-to-build outer area.
That is the practical reason to be wary of one city-wide figure in either direction. A “city down 5 per cent” headline can sit alongside suburbs that barely moved and others that fell harder. Our guide on house prices, downturns and auctions covers how to read those signals at street level. And if you are weighing up where growth might come from, the recent look at cheap regional markets investors keep circling shows how different local drivers can be.
What to check before reacting
Ask what underpins value where you are looking, not what the city did on average.
- Is the area short of land, or can new supply arrive easily?
- Is demand tied to amenity, transport or planned infrastructure?
- Are you comparing houses with houses, and apartments with apartments?
- Does your time horizon span more than one cycle?
The long-run fundamentals remain supportive, but they play out locally. Pull the five-year data for your own Local Government Area, split by dwelling type, before you decide anything.
Subscribe to the newsletter for weekly analysis that looks past the headline number.
General info, not financial advice.