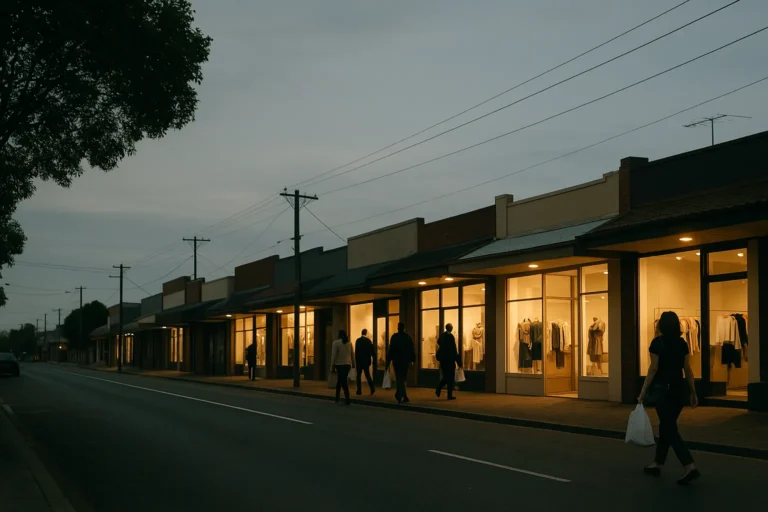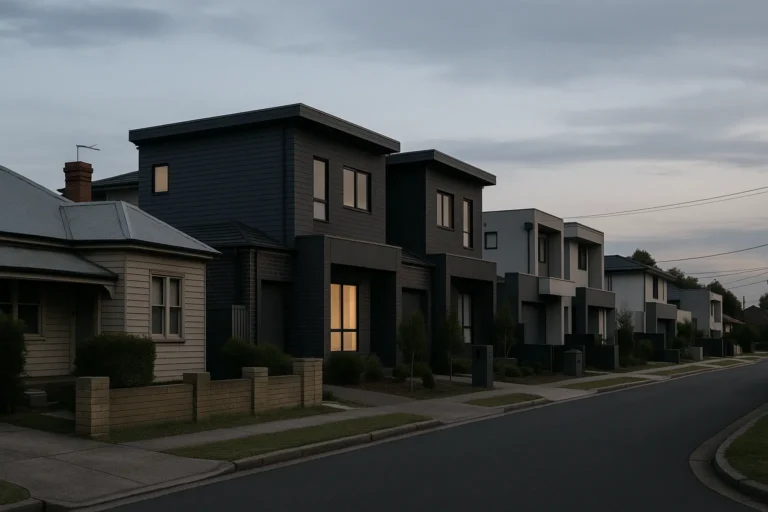
Sydney house prices have shed $87,000 since November, marking six consecutive months of declines. The median house sits at $1.545 million, down 5.8 per cent from the peak. Units peaked later, in February, and have fallen 3.2 per cent since.
The headline is familiar, the velocity less so. What separates this correction from the usual post-rate-hike softening is the simultaneous withdrawal of investor demand. The federal Budget’s May tax changes targeted investment vehicles, particularly self-managed super funds holding property. Investor search activity on major listing platforms dropped immediately after, and lending data confirmed the pullback.
Rate rises constrain what any buyer can borrow. The tax measures narrow the pool of buyers willing to compete at all. Together, they compress both sides of the market at once.
Why houses are falling faster than units
Larger mortgages amplify rate sensitivity. A house buyer in Sydney needs to service $1.5 million-plus, so each 25-basis-point move translates to bigger monthly repayment jumps than a unit buyer faces. Serviceability buffers tighten faster at the top end.
Units, meanwhile, attract a different buyer mix: more first-timers using government deposit schemes, more downsizers with equity already banked, fewer investors chasing yield in a falling market. The unit segment hasn’t escaped downward pressure, it’s just absorbing it more slowly because the buyer composition is less rate-exposed and less tax-policy-exposed.
Regional NSW markets held flat in August and remain 4.8 per cent higher year-on-year. The affordability gap is wide enough now that buyers priced out of Sydney are moving search activity, not just wishful browsing.
The dual headwind: credit and tax
Rate hikes hit everyone. The Budget’s changes to negative gearing offsets, capital gains concessions and super fund property holdings hit investors specifically. Investor borrowing has pulled back measurably since May.
Less investor activity means fewer bidders at auction, less urgency among vendors to test the market, and more listings that sit or withdraw. The spring selling season will test whether supply rises faster than remaining demand can absorb.
The catch
- House prices down 5.8% from peak, units down 3.2%
- Investor search activity fell after Budget, confirmed by lending data
- Regional NSW prices flat in August, still up 4.8% year-on-year
- Spring listings will show whether vendor urgency overtakes buyer hesitation
Government points to 75,000 first-home buyers aided by tax reforms and the 5 per cent deposit guarantee. Opposition argues the same deposit scheme pumps demand into a supply-starved market, risking negative equity for recent buyers if prices keep falling. Completions have dropped from around 200,000 annually to 170,000, and tax changes are projected to remove thousands of transactions from the pipeline each year.
What determines the next six months
Two variables: RBA moves and spring listing volumes. If rates hold or start cutting, serviceability eases and demand stabilises. If spring brings a flood of listings from vendors who’ve held off, absorption becomes the question. A large supply increase without demand recovery extends the correction.
Investor activity isn’t returning until tax settings clarify or yields improve enough to offset the new frictions. Owner-occupiers remain constrained by serviceability. First-home buyers using government schemes are active but represent a narrow slice of total transactions.
The Brisbane property market has already seen pockets fall 10 per cent as its post-pandemic boom unwound. Sydney’s correction is deeper in dollar terms but proportionally similar in the segments most exposed to credit tightening.
Scenarios over spring
Base case: prices drift lower another 1-2 per cent through spring as listings rise modestly and rate uncertainty keeps buyers cautious. Investor demand stays subdued. Houses continue to underperform units.
Upside: RBA signals cuts sooner than expected, serviceability improves, and buyer confidence returns before listing volumes spike. Prices stabilise by year-end.
Downside: spring listings surge, vendors chase clearance over price, and a large volume of stock hits a shallow buyer pool. Correction accelerates another 3-4 per cent into early next year, particularly in premium house segments.
What to watch next
Auction clearance rates through September and October. If clearances hold above 60 per cent, absorption is keeping pace. Below 55 per cent signals vendor urgency is outrunning demand.
Investor lending data each month. If investor borrowing stabilises or ticks up, the tax-policy drag is fading. If it keeps falling, the dual headwind persists.
RBA commentary on inflation and wages. Any language shift toward earlier easing changes serviceability math immediately.
Practical take
If you’re buying in Sydney now, house segments are seeing the deepest discounts but also the highest ongoing rate sensitivity. Units offer smaller falls but more stable buyer competition. Run your serviceability at another 50 basis points higher to stress-test what happens if the RBA holds longer than expected.
If you’re selling, spring will clarify whether your suburb can absorb new stock or whether holding into early next year makes sense. Watch your local clearance rates weekly, not the city-wide average.
If you’re watching from the sideline, the correction isn’t over. The next three months will show whether this is a 5-7 per cent reset or something deeper.
Subscribe to the newsletter for the weekly signal on what changed and what didn’t across Australian property markets.
General info, not financial advice.