Brisbane’s property market has shifted into reverse after a decade-long run that saw dwelling values jump 116.6 per cent, the strongest capital city performance nationally. Prices in some outer areas have dropped between 5 and 10 per cent from recent peaks, with the broader market down 0.6 per cent in July and 0.6 per cent for the quarter.
The pullback follows years of exceptional gains. Over the past ten years, Brisbane outpaced every other capital. Adelaide came second with 110.1 per cent growth, followed by Perth at 107.2 per cent. Houses that traded for $920,000 to $950,000 in northern suburbs like Caboolture are now changing hands for $800,000 to $870,000.
Where values fell hardest
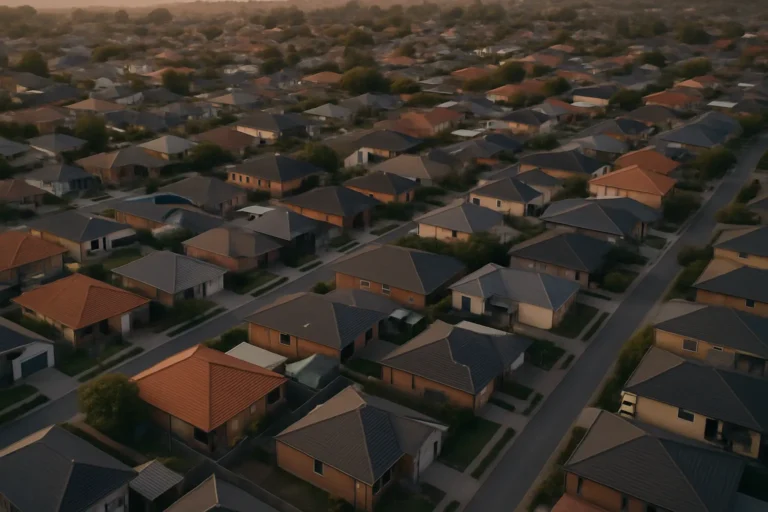
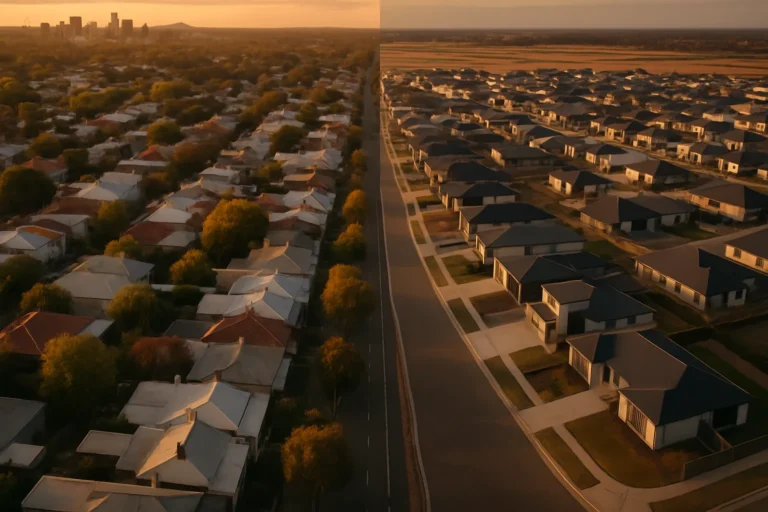
Outer-ring areas on the northern fringe of greater Brisbane have seen the steepest corrections. Buyer activity has thinned dramatically compared to twelve months ago, when open homes drew queues and properties regularly sold above asking price.
The shift is visible at street level. Where inspections once required crowd control, agents now report sparse attendance and extended days on market. The number of active buyers has contracted sharply, though those still transacting tend to have stronger financial positions.
The catch
- Caboolture and Caboolture South down 5-10% from recent peaks
- Properties now trading $50,000 to $150,000 below 2024 highs
- Brisbane dwelling values fell 0.6% in July, 0.6% for the quarter
- Inner-city apartments still up 17.1% year-on-year despite cooling
- Rental vacancy rates near 1%, median rent now 59% of $70k take-home pay
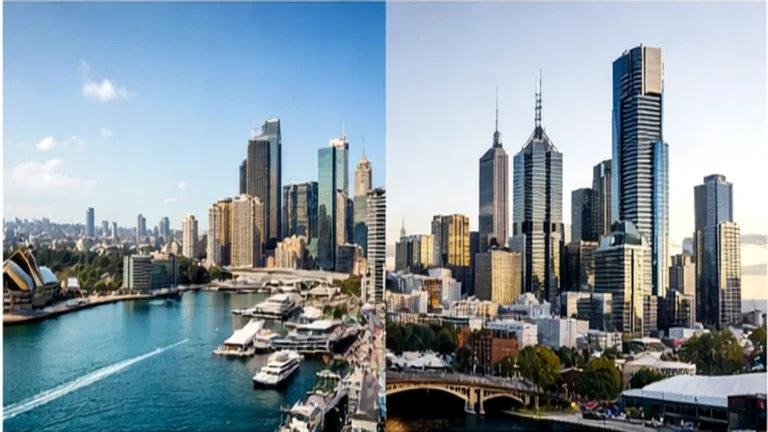
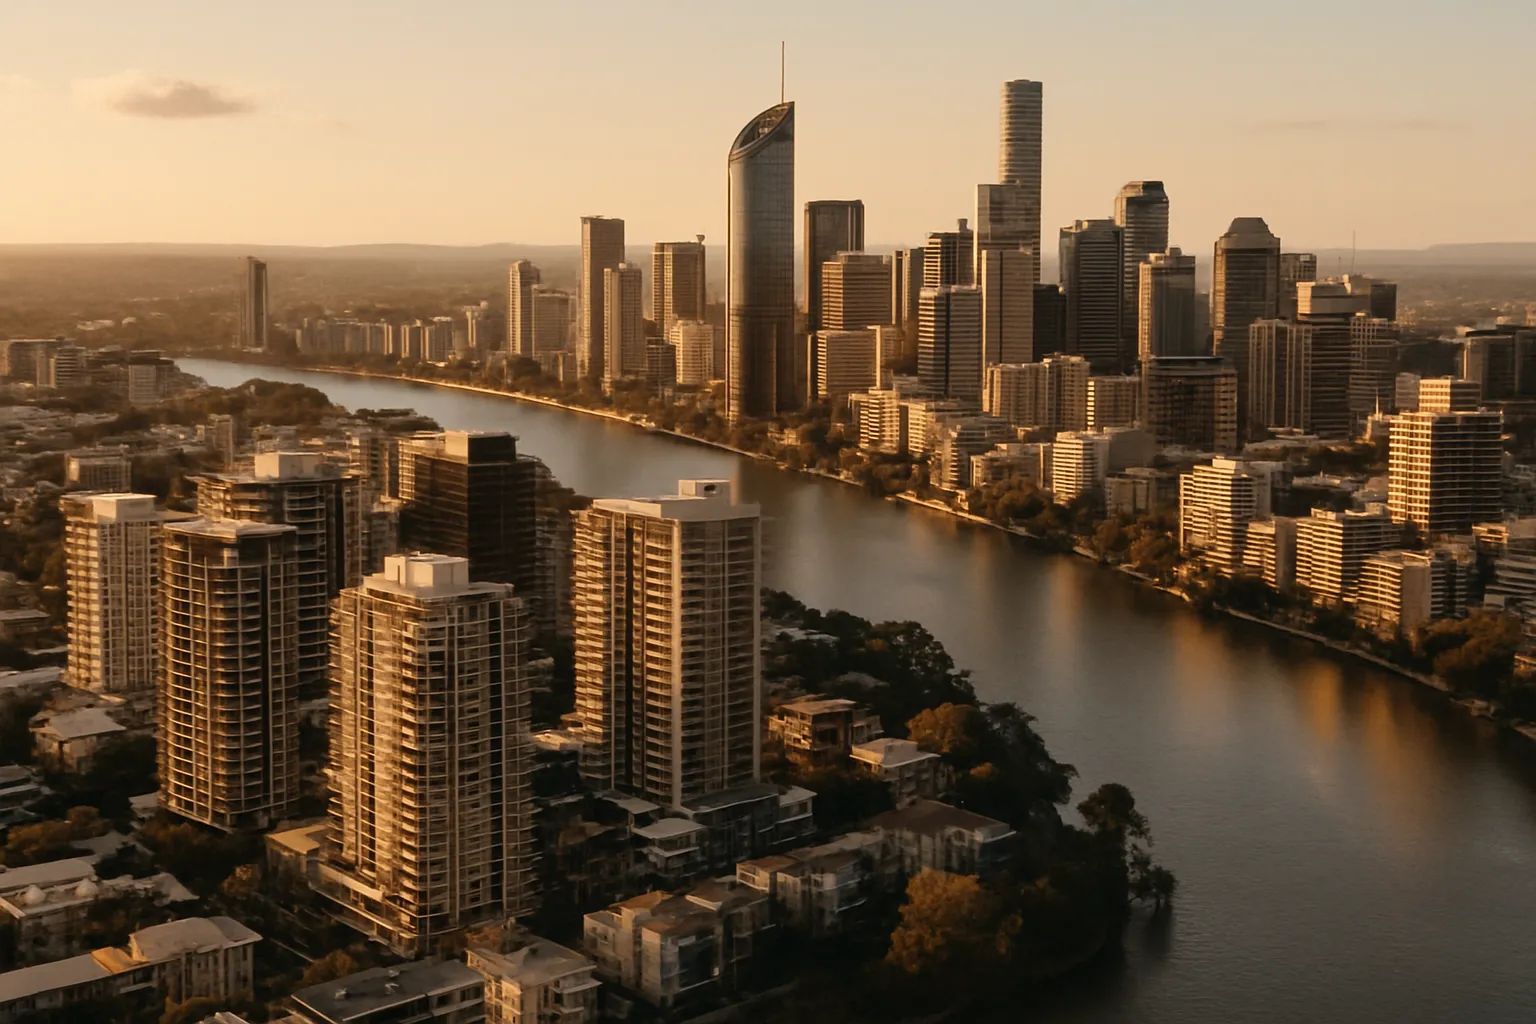
Brisbane apartments now carry a median value of $875,135, just 1.7 per cent below Sydney’s $889,617. That makes Brisbane units the nation’s second most expensive, a position built on post-pandemic migration flows and house-price lockout.
How apartments led the rally
Between 2016 and 2019, inner-city apartments faced oversupply. Then house prices accelerated sharply, pricing buyers out of detached housing and pushing demand back toward units. Interstate migration during the pandemic reinforced the trend, with Sydney and Melbourne residents selling million-dollar homes and upgrading lifestyle for $600,000 to $650,000 in Brisbane.
That wave pushed apartment values up faster than houses initially, particularly in inner and middle-ring locations. Over the past year, Brisbane apartments gained 17.1 per cent while houses rose 14.3 per cent. The apartment premium has now begun to compress as migration volumes normalise and affordability constraints bite.
Structural case versus cycle position
Brisbane’s fundamentals remain distinct from other capitals facing deeper corrections. Population growth continues, employment markets stay relatively tight, and affordability, while stretched, remains better than Sydney or Melbourne on a price-to-income basis.
The city also carries a $7.1 billion infrastructure pipeline tied to the 2032 Olympics, which historically correlates with price growth in host cities. Data across Olympic host cities since 1996 shows residential prices grew an average 42.5 per cent in the four years after the Games, compared with 23.3 per cent in the four years beforehand.
Construction timelines matter here. Labour and materials competition from the infrastructure program could constrain new residential supply through to 2031, supporting both rents and values if vacancy rates stay compressed.
Commercial pivot after SMSF rule change
Early August changes preventing self-managed super funds from borrowing to buy residential property have shifted some investor demand toward commercial assets. The policy adjustment, introduced to secure support for broader housing affordability measures, removed a significant buyer cohort from the residential market.
Commercial property typically delivers higher yields and longer lease terms, though vacancy risk runs higher and liquidity is lower. The shift has been pronounced enough to register in recent transaction volumes, with buyers who missed the SMSF cutoff or reassessed strategy moving to retail, office and industrial assets.
Trade-offs for buyers now
Anyone buying in the current window faces two scenarios. Base case: Brisbane absorbs the correction over 12 to 18 months, consolidates, then resumes growth as infrastructure spending accelerates and supply constraints tighten from 2029 onward. Downside: if interest rates stay elevated longer than markets expect or unemployment rises materially, the correction extends deeper and longer, requiring several years to recover lost ground.
The distinction matters for entry timing. Properties down 5 to 10 per cent from peak may fall another 5 per cent if credit conditions tighten further, similar dynamics are already playing out in Melbourne, where prices have dropped below 2020 levels. But waiting for the exact bottom risks missing the turn if buyer competition returns quickly once rates stabilise.
Inner and middle-ring suburbs with owner-occupier depth, proximity to Olympic precincts, and improved connectivity from projects like Cross River Rail carry the least downside risk. Outer-fringe locations face greater sensitivity to serviceability and jobs-access trade-offs.
What happens next four months
Nationwide, only three capitals held positive in July: Darwin up 0.8 per cent, Perth and Hobart each up 0.1 per cent. Sydney fell 4 per cent for the quarter, Melbourne dropped 3.4 per cent, Canberra declined 2.1 per cent. The combined capital city median now sits at $1.01 million, down 0.9 per cent for the month and 2.5 per cent for the quarter.
Brisbane’s trajectory depends heavily on the next RBA decision. Market pricing now puts a November rate hike at 97 per cent probability, which would further reduce borrowing capacity and slow transaction volumes. Any delay or reversal would likely stabilise prices faster.
Rental vacancy rates nationally have lifted to 1.5 per cent, but Brisbane remains tighter at near 1 per cent, supporting rental growth even as capital values soften. That divergence creates a yield cushion for investors with long hold periods.
Practical take for investors
If you’re weighing entry now, pressure-test your cashflow assumptions against a further 5 per cent price fall and borrowing costs staying at current levels for another 18 months. Properties showing genuine rental demand and infrastructure connectivity offer the clearest path back to positive equity if the market takes longer to turn.
Avoid outer-fringe locations unless you’re buying strictly for yield and can hold through a multi-year consolidation. Check days on market and clearance rates in your target suburb over the past three months, sustained weakness indicates further price discovery ahead.
For those already holding Brisbane assets, the fundamentals support a patient approach. The boom is finished, but the structural case, population growth, infrastructure pipeline, supply constraints, argues for recovery rather than collapse. Subscribe to Australian Property Review for weekly analysis on when buyer conditions shift.
General info, not financial advice.