Australia has never had more cranes in the sky. The September quarter 2026 tally reached 896, up from 840 six months earlier. It looks like a building boom. For anyone trying to read where housing supply goes next, it is closer to a rear-view mirror.
That is the core point from property researchers who reviewed the count. Cranes measure projects that were funded, approved and started some time ago. They say little about the schemes that have not yet reached a construction start. Those are the ones that decide how many homes arrive in two to four years.
What the record count actually shows
Homes and mixed-use schemes account for 650 of the 896 cranes, close to three in every four. Melbourne leads with a record 224, passing its 2019 peak of 222. Its residential count rose by 24 to 108, helped in part by affordable and public housing work.
South East Queensland climbed from 153 to 178 cranes. The Gold Coast set a record of 82, with 72 on residential jobs, and it still has more cranes than Brisbane. Brisbane’s residential cranes moved from 43 to 54. The Sunshine Coast doubled to 16.
Sydney went the other way. It lost 15 residential cranes and sits at 189.
Then there is the sector that is not housing at all. Data centre cranes jumped 38.9 per cent, from 36 to 50, with 31 of them in Melbourne. Nationally, that now matches civil construction. Every one of those cranes is a lift of steel and labour that is not going into homes.
Why cranes lag the real story
A crane goes up after a developer has locked in finance, pre-sales and a builder. By then the project has already cleared the hardest tests. The count therefore reflects decisions made when the numbers still stacked up.
The projects waiting behind them face a different environment. Researchers point to higher borrowing, fuel, materials and labour costs, plus skills shortages and a softening market. When the cost to build rises faster than the price buyers will pay, the feasibility study fails. The project does not get cancelled with a headline. It just sits, then gets re-costed, then sits again.
That is the quiet part of the cycle. A stalled feasibility never shows up as a falling crane count today. It shows up as a gap in completions later.
From stalled projects to a completions gap
Here is a rough way to think about it, without pretending to precision. Today’s cranes will mostly finish and add stock over the next year or two. After that, completions depend on whatever commenced in the meantime. If commencements are thin because projects failed feasibility, completions thin out with a delay of several years.
That timing matters for national targets. We covered the scale of the Housing Accord shortfall, which sits 130,000 homes behind, and a record crane count does not change that arithmetic. A busy skyline today can coexist with a weak delivery pipeline tomorrow. The two are measuring different points in the same chain.
Key numbers
- 896 cranes nationally in the September quarter 2026, up from 840 six months earlier
- 650 of those on homes and mixed-use projects, close to three in four
- Melbourne at a record 224; Sydney down 15 residential cranes to 189
- Data centre cranes up 38.9 per cent, from 36 to 50
Approvals are not the bottleneck
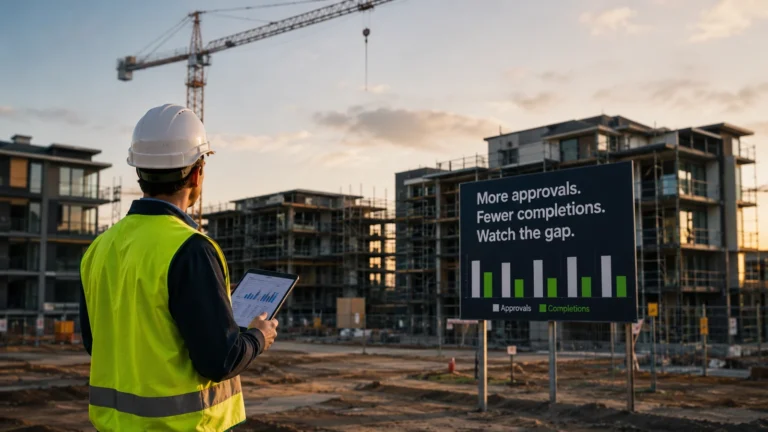
A property analyst’s argument is that the problem is delivery, not permission. Rezoned capacity and approved dwellings can look healthy while very little gets built. The numbers worth watching are commencements and completions, because they track what actually gets poured and finished.
This fits what we have already seen in home building starts, which lifted but with a thinning pipeline behind them. A single strong period of starts does not rebuild a pipeline if the projects feeding it are being shelved on cost grounds.
Builder capacity is part of the same squeeze. Construction insolvencies have raised the risk of a second wave, and the data centre build-out competes for the same trades and materials, as we outlined in our look at how datacentre construction is squeezing builders.
What could derail the gloomy reading
There is a fair counterargument. Costs could ease, interest rates could fall, and projects now parked could become viable again. State and federal support for affordable and public housing, which is part of Melbourne’s growth, could also widen. Cranes are lumpy, and one quarter is not a trend.
The other unknown is mix. Some of the strength sits in Queensland and in non-residential work. A crane count that rises overall can still hide a residential shortfall in the cities where demand is greatest, with Sydney the clearest example of the regional split.
What this means for readers
If you are an investor or buyer weighing off-the-plan or new-build supply, do not read the crane count as proof that supply is solved. Look instead at commencements, project-level feasibility and builder capacity in the specific market you care about. A tight completions window later tends to support existing stock in areas with limited new supply, though that is a probability and not a promise.
Next step: before relying on any “supply boom” headline, check the latest commencements and completions figures for your target city, not the crane tally. For a wider primer, see our guide to housing supply, approvals and building costs.
For the weekly signal on supply and rates, subscribe to the Australian Property Review newsletter.
General info, not financial advice.