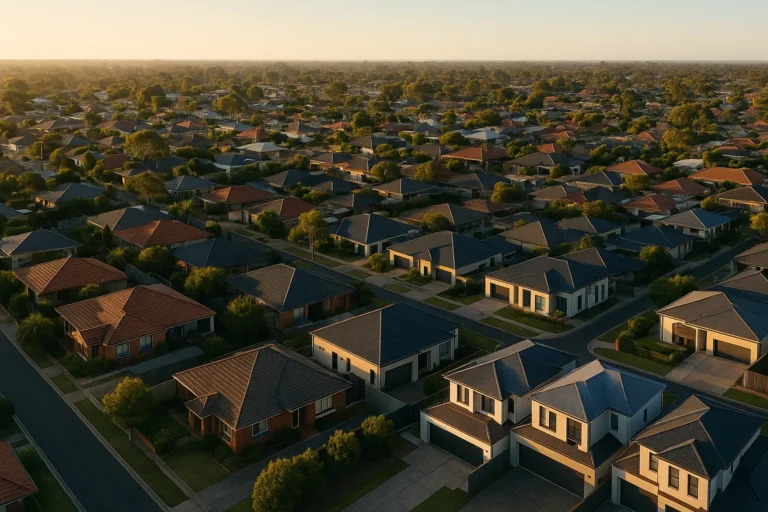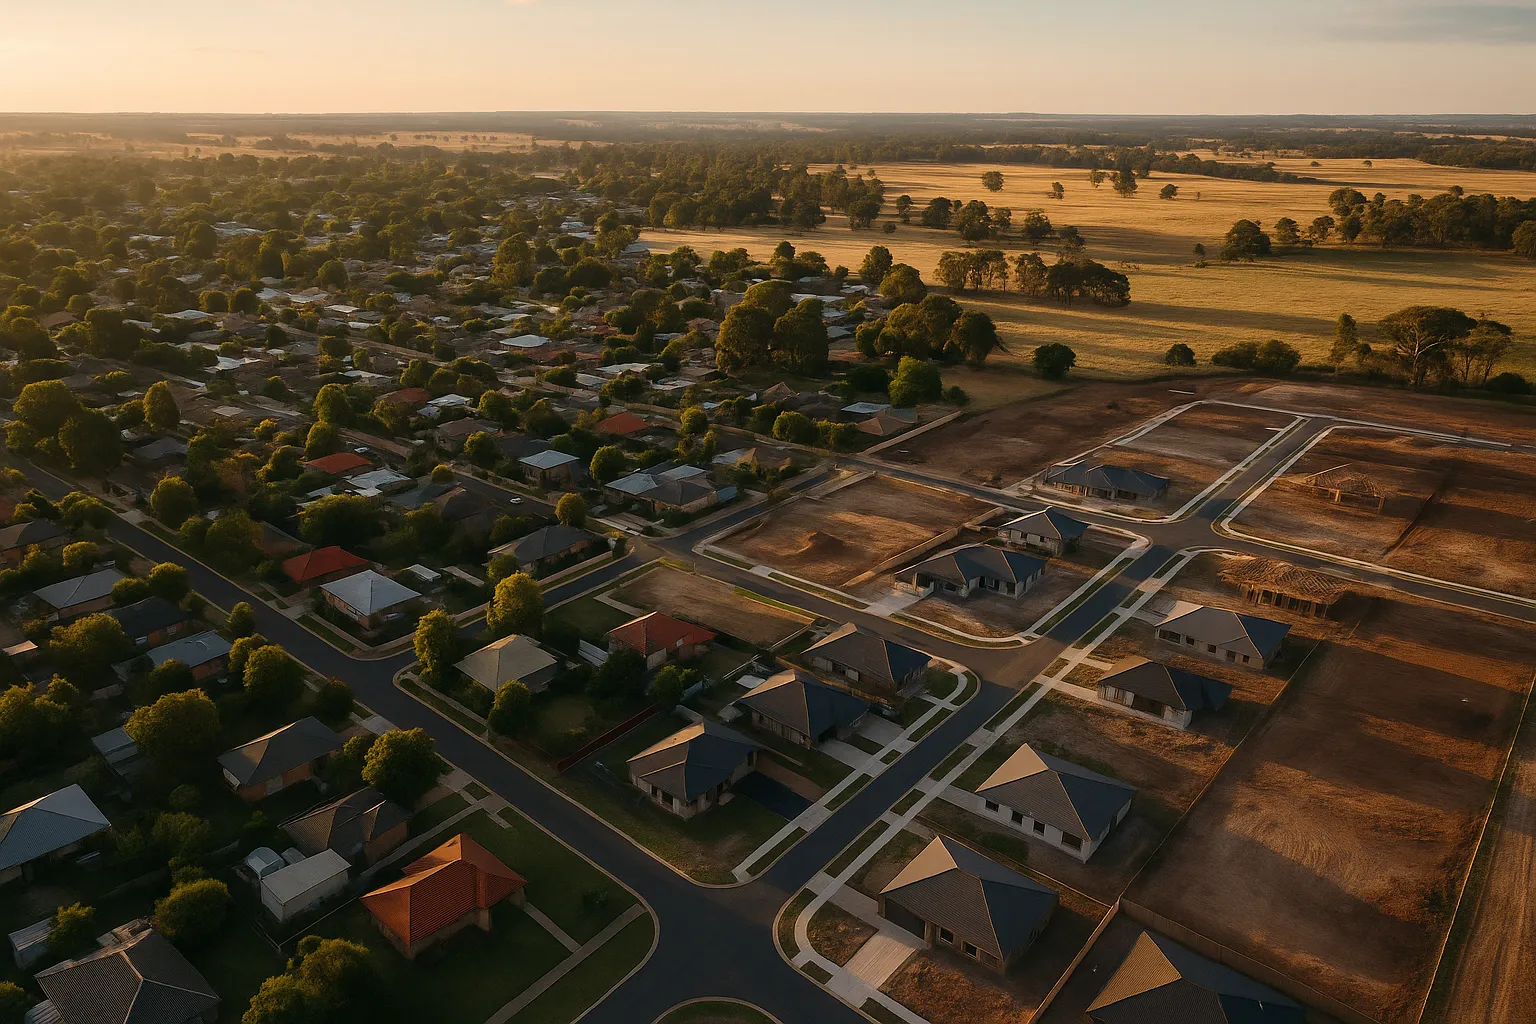
Non-capital city dwelling prices dropped 1.1% in the September quarter, a modest headline figure that masks sharp divergence beneath the surface. The combined regional median conceals towns where employment concentration, pandemic-era oversupply or weak rental yield are compounding pressure, alongside others where structural fundamentals, university enrolment, resources sector activity, retiree migration, are acting as a floor.
The question for anyone holding or eyeing regional exposure: how do you tell which camp a given market sits in?
The 99% decade and what drove the last stretch
Over ten years to mid-2025, non-capital city home prices doubled (up 99.4%, per Cotality data) compared to 57.7% across the eight capitals. The pandemic years delivered the bulk of that outperformance: tree-changers, remote workers, retirees cashing out Sydney apartments. Population inflows have since normalised, leaving behind a supply pipeline that in some markets was already marginal and in others tipped into modest oversupply.
Capital city prices fell 3.7% over the same September quarter. The regional decline, smaller in percentage terms, reflects two offsetting forces: tight land supply in lifestyle hubs where demand remains (Hervey Bay, Port Macquarie, parts of the Central Coast), and sharper retreats in towns where the pandemic pulse has fully reversed and no structural driver replaced it.
Which regional markets carry the highest downside risk
Three characteristics flag vulnerability:
- Single-industry employment base. Towns reliant on one manufacturer, logistics hub or government facility face amplified risk if that employer scales back. A 10% workforce reduction in a capital is diffused; the same cut in a 15,000-person town moves the dial on vacancies and distressed sales.
- Pandemic construction surge without sustained migration. Subdivisions approved in 2021–22 are settling now. If net migration has returned to pre-2020 levels (or turned negative), new supply meets thinner buyer pools.
- Weak rental yield and negative cashflow at current rates. Markets where gross yields sit below 4.5% and borrowing costs exceed 6% leave landlords dependent on capital growth. As price appreciation stalls, investors exit, removing a demand pillar.
Conversely, markets with diversified employment (university towns, regional hospitals, aged care clusters), constrained land release and yields above 5.5% show smaller declines and faster stabilisation.
The supply shortage argument, and where it doesn’t hold
“Shovel-ready land shortages” and “pent-up demand” are cited as reasons regional downturns stay shallow. That’s accurate for coastal lifestyle markets where council planning hasn’t kept pace with retiree and sea-changer inflows, land supply genuinely lags underlying household formation.
It’s less true in inland centres where subdivision approvals accelerated during the boom and population growth has since stalled. Pent-up demand implies people waiting to buy; in practice, some regional markets now face pent-up supply, dwellings built for a migration wave that didn’t sustain.
Key numbers
- Non-capital city median dwelling price: down 1.1% in the September quarter (Cotality)
- Capital city median: down 3.7% same period
- Regional price growth over 12 months to September: +7.7%
- Capital city growth same period: +1.1%
- Ten-year regional growth: 99.4% vs 57.7% for capitals
The timeline: when does the regional correction bottom
One forecast supplied in the source material anticipates stabilisation by late 2025 or early 2026, citing tight labour markets and supply constraints. That’s plausible for markets with structural demand anchors (resources activity in Central Queensland, aged care and health precincts in northern NSW coastal towns). It’s optimistic for towns where the primary driver was pandemic relocation and no replacement demand stream has emerged.
Base case: markets with diversified employment and sub-5% vacancy flatten by mid-2026. Markets dependent on a single employer or facing new-dwelling oversupply see falls stretch into late 2026, with total peak-to-trough declines in the 8–12% range.
Upside risk: faster RBA easing or renewed interstate migration (driven by capital city affordability stress) brings buyers back sooner. Downside: a resources sector pullback or further rate hikes extend the correction another 6–9 months.
What investors and buyers should focus on now
If you’re considering regional exposure, whether as an investment or a lifestyle purchase, pressure-test these inputs:
- Employment diversity. Count the top three employers. If they account for more than 40% of the workforce, price any purchase for the risk one exits or downsizes.
- Rental yield after costs. Gross yield above 6% provides cashflow buffer; below 5%, you’re banking on capital growth resuming within 18 months.
- Vacancy trend. Ask a local property manager for their current vacancy rate and whether it’s moved in the past six months. Anything above 4% and rising signals oversupply.
- New dwelling pipeline. Check council approvals over the past three years. A spike in 2021–22 that wasn’t matched by sustained population inflows means supply is still landing.
- What would bring buyers back. If the answer is “rate cuts” alone, the market is speculative. If it’s retiree migration, university growth, or resources expansion, there’s structural demand underneath.
For sellers in vulnerable markets: if your timeframe allows, holding through the trough (likely 12–18 months) avoids crystallising a loss. If you need to exit, price 5–8% below recent comparables to clear quickly, sitting on market during a correction erodes your position faster than a sharp initial discount.
The catch
Regional property as an asset class delivered exceptional returns over the past decade, but the drivers were one-off (pandemic migration, record-low rates, urban exodus). Assuming those conditions repeat, or that “pent-up demand” will automatically refill buyer pools, ignores the structural differences between regional markets. Some will stabilise quickly; others face a longer, deeper correction. The aggregated data doesn’t tell you which camp a specific town sits in, only local employment, supply and yield dynamics do.
Subscribe to the newsletter for weekly regional market updates and yield analysis.
For negative gearing and cashflow implications in a correction, see Negative gearing borrowing power cut: investor loses deal mid-settlement. For yield pressure in metro markets, Rentvesting strategy fails the cashflow test in 2026.
General info, not financial advice.