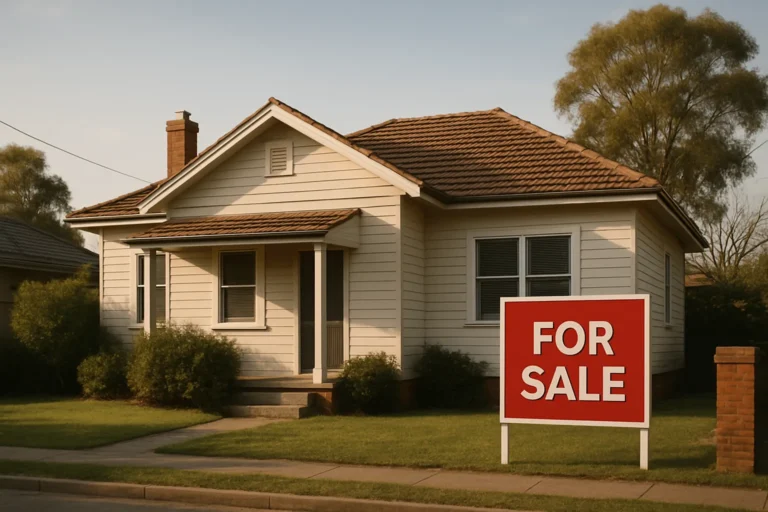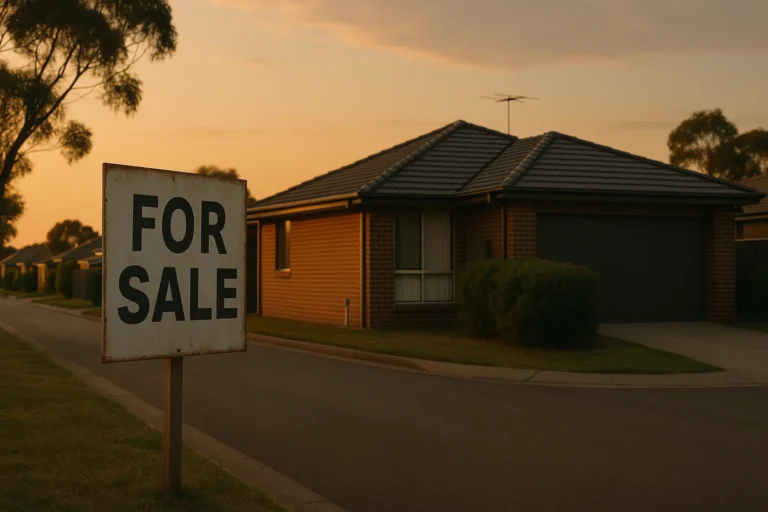
The housing downturn has changed address. Perth and Brisbane, the two big capitals that powered the boom into 2026, are now falling faster than anywhere else, and the speed has caught forecasters off guard.
In October 2026, combined-capital dwelling prices fell for a seventh straight month. They now sit roughly 8% below the March 2026 high. Brisbane lost 2% in October alone and Perth lost 1.7%. Both are now more than 8% off their peaks. Melbourne’s monthly fall eased to 0.8%, while Sydney remains about 10% down.
From 26% growth to the sharpest falls
The turnaround is stark. In April 2026, Perth was up 26% over the year and Brisbane was up nearly 20%. As recently as July, NAB had pencilled in falls of only 2-4% for markets like these. It has since deepened its expected total decline to about 14%, up from 11%, and sees no bottom until mid-2027 at the earliest.
CBA is more bearish again. It now projects declines near 18% in Brisbane and Perth, compared with roughly 8% in its September view, and cites overexuberance as part of the reason.
That is a big revision in a short time. When forecasters shift this far this quickly, it usually means the first-round assumptions missed how much of the earlier gain was momentum rather than fundamentals.
Why boom markets reverse hardest
Here’s the mechanism, in plain English.
A mid-sized market that runs hard for a couple of years tends to attract a particular mix of buyers: investors chasing growth, and owner-occupiers stretching to get in before prices move again. Both groups are sensitive to borrowing costs and to tax settings. Both are also the first to step back when those settings turn.
The RBA’s November hike was its fifth this year. Each rise trims what a borrower can service. In markets where affordability was already stretched, a small fall in borrowing power removes a large share of the buyer pool. Fewer buyers means fewer bids, and prices that were set at the margin by the most stretched buyer move down first.
There is also a momentum effect on the way down. Sellers who priced off last year’s sales find the market has moved. Some cut quickly. Others wait, which lifts listings and lengthens selling times. That feeds back into buyer caution.
The early indicators were already flashing
The cooling shows up in several places:
- Time to sell has about tripled in Perth and Brisbane since January 2026, though from very low levels.
- Investor loan commitments dropped nearly one-third in the September quarter.
- Owner-occupier lending fell about 5%, mostly in June and July.
The investor number matters most. Investors had been a key support in these cities. When they pull back by this much, the demand that was holding up prices at the margin goes with them.
The low base for selling times is worth keeping in view. Tripling from a very short period still leaves many properties selling quickly by historical standards. The direction is the signal, not the absolute level.
What it looks like for lenders and brokers
The slowdown is flowing into transaction volumes. A Sydney broker reported settlements of about $305 million from July to October 2026, compared with $415 million a year earlier. That is a fall of roughly a quarter. The broker is leaning more on existing client books and commercial lending to fill the gap.
That is a sensible response, and a useful reminder that a downturn hits flow before it hits stock. Fewer transactions come first. Distressed sales, if they come, tend to follow later.
Where resilience may sit
The pattern points to a general rule of thumb: the markets that rose fastest on affordability-stretched demand are the ones most exposed when rates and tax settings tighten. The markets with a tighter supply pipeline and a more established owner-occupier base have less froth to lose.
That does not make them immune. Sydney is still about 10% down. But the shape of its fall has been steadier, while Perth and Brisbane have turned sharply. If supply constraints are the anchor, resilience is more likely to sit where new housing is hard to add and where buyers are less reliant on momentum.
We cannot say from this data which suburbs or price tiers will hold up best. That needs finer-grained evidence than a capital-city index. What the numbers do show is that the cycle punishes speed on the way up.
What would change the call
The base case from NAB is a bottom no earlier than mid-2027. That assumes rates stay restrictive for some time and that lending stays soft. If rate rises stop sooner, or if buyers return faster than expected, the decline could be shallower. If the cooling in lending deepens, the CBA projection of an 18% fall in Brisbane and Perth looks more plausible.
Two things are worth watching over the next few months: whether time to sell keeps stretching, and whether investor lending stabilises or keeps dropping.
Key numbers
- Combined capitals: seven straight monthly falls to October 2026, about 8% below the March 2026 high
- Brisbane and Perth: both more than 8% off peak after October falls of 2% and 1.7%
- NAB: expected total fall now about 14%, up from 11%, bottom not before mid-2027
- CBA: Brisbane and Perth declines near 18%, up from roughly 8% in September
- Investor loan commitments: down nearly one-third in the September quarter
The practical take
If you own or are looking at property in a market that ran hard in 2025 and early 2026, assume the correction has further to go and stress-test your repayments against more rate pressure, not less. Check your cash flow buffer before you worry about price. If you are a buyer, the shift in selling times suggests you have more room to negotiate, but a falling market rewards patience, not speed.
For a wider view of how downturns unfold, see our guide to house prices, downturns and auctions. For the lending side, borrowing capacity has fallen faster than home prices, which helps explain why demand has thinned.
Subscribe to the newsletter for the weekly signal on rates, lending and prices.
General info, not financial advice.